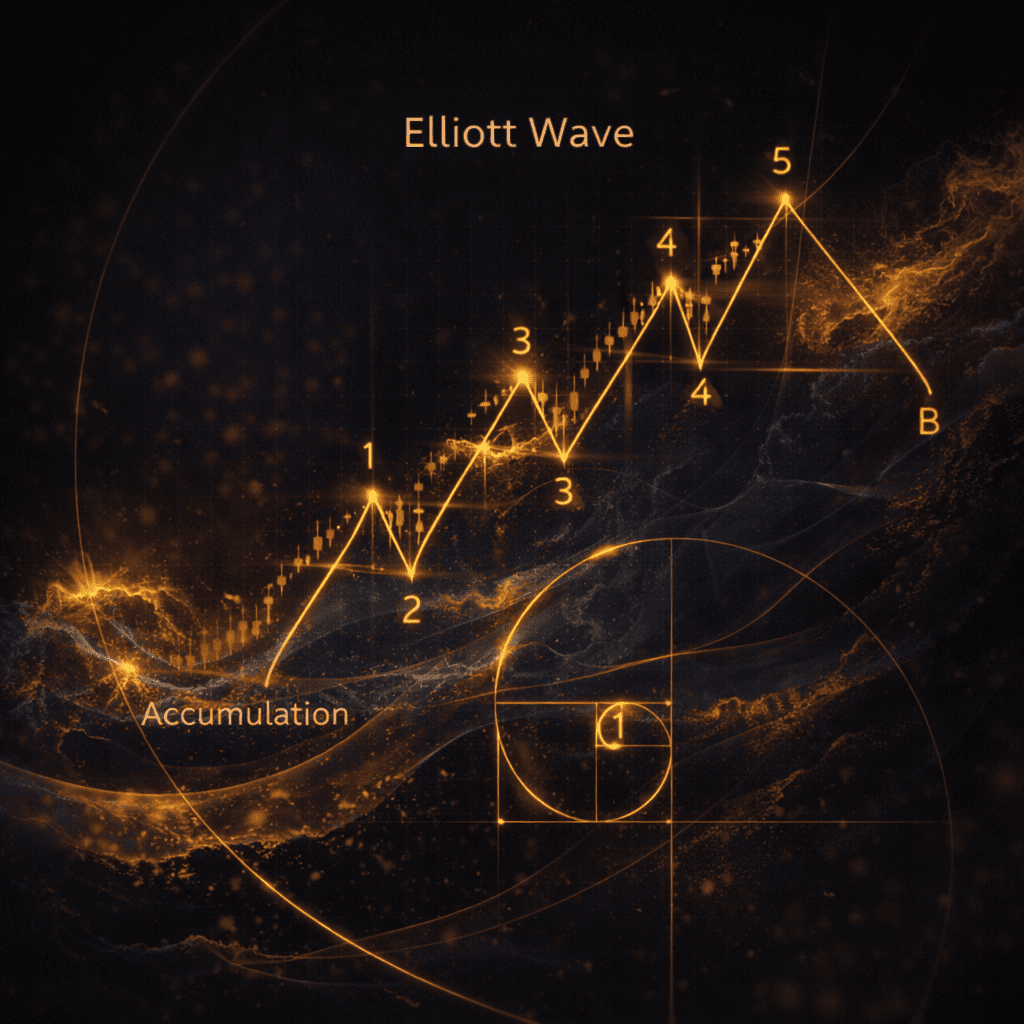
Elliott Wave Theory: Riding the Waves of Market Psychology
Trading Theories & Theorists Series. 2/10
The Basic Pattern: The 5-3 Wave Structure
Elliott’s core insight: Markets move in cycles of five waves in the direction of the trend, followed by three waves against it.
The Impulse Wave (5 Waves)
In an uptrend, the five waves break down as:
Wave 1: The initial move. Often unnoticed by the crowd. Early adopters and smart money begin accumulating.
Wave 2: The first correction. Prices pull back but don’t break below Wave 1’s start. This is where doubt creeps in. “Was that it?”
Wave 3: The strongest, longest wave. The trend becomes obvious. The public joins. This is where most trend-following profits are made. Wave 3 is never the shortest impulse wave.
Wave 4: Another correction. More complex than Wave 2. Profit-taking occurs. Often sideways or choppy. Wave 4 never enters Wave 1’s price territory.
Wave 5: The final push. Enthusiasm peaks. Momentum divergences appear. The trend exhausts itself, setting up the reversal.
The Corrective Wave (3 Waves)
After five waves up, the market corrects in three waves:
Wave A: The first leg down. Looks like a pullback. Some traders buy the “dip.”
Wave B: A counter-trend rally. Traps bulls thinking the uptrend resumed. Often retraces 50-61.8% of Wave A.
Wave C: The devastating leg down. Panic selling. Wave C often equals Wave A in length or extends to 1.618× Wave A.
The Complete Cycle: 5 up + 3 down = 8 waves. Then the pattern repeats at the next higher degree.
The Three Rules (Never Break These)
Rule 1: Wave 2 never retraces more than 100% of Wave 1
If Wave 2 goes below Wave 1’s start, your wave count is wrong. Relabel.
Rule 2: Wave 3 is never the shortest impulse wave
Wave 3 can be shorter than Wave 1 or Wave 5, but not both. Usually, Wave 3 is the longest and strongest.
Rule 3: Wave 4 never overlaps Wave 1’s price territory
In an impulse sequence, Wave 4 must stay above Wave 1’s high (in uptrends) or below Wave 1’s low (in downtrends). An overlap invalidates the impulse count.
Violation = Relabel: These rules are absolute. If you see a “Wave 4” entering Wave 1 territory, you’re not in an impulse wave. It’s something else. possibly the start of a larger correction.
Types of Corrective Patterns
Not all corrections are simple ABC zigzags. Elliott identified several complex corrective patterns:
Zigzag (5-3-5)
A sharp, steep correction. Waves A and C are impulses; Wave B is a simple correction. Common in Wave 2 corrections.
Flat (3-3-5)
A sideways correction. Waves A and B are three-wave moves; Wave C is an impulse. Often forms when the trend is strong and refuses to correct deeply.
Triangle (3-3-3-3-3)
A five-wave sideways pattern (ABCDE). Each sub-wave is a three-wave move. Triangles indicate consolidation before the final thrust (Wave 5 or Wave C).
Types: Ascending, descending, symmetrical, and expanding triangles.
Double and Triple Threes
Combinations of simpler corrections (zigzags and flats) connected by an intervening wave called “X.”
Double Three: W-X-Y
Triple Three: W-X-Y-X-Z
These complex corrections take time and frustrate traders. They’re common in Wave 4 and Wave B positions.
Common Mistakes (And How to Avoid Them)
Mistake 1: Forcing the Count
New Elliotticians see waves everywhere. “Is this Wave 4 or Wave B?” They twist the analysis to fit their bias.
Solution: If the wave count isn’t obvious, you don’t have one. Wait for clarity. Use other tools (trend lines, moving averages) until the pattern emerges.
Mistake 2: Ignoring the Rules
“Wave 4 overlapped Wave 1, but it’s probably fine…”
Reality: The rules exist because they work. An overlap means you’re in a correction, not an impulse. Relabel immediately.
Mistake 3: Prediction Without Confirmation
Elliott Wave tells you what might happen, not what will happen. Counting “1-2-3-4-5” and projecting Wave 6 is fantasy.
Reality: Use wave counts as a roadmap, not a guarantee. Confirm with price action, volume, and other indicators.
Mistake 4: Ignoring Alternation
If Wave 2 was deep and simple, expect Wave 4 to be shallow and complex (or vice versa). This principle. alternation. helps anticipate corrections.
Elliott Wave vs. Dow Theory
Combined Power: Use Dow Theory to determine if you’re in a bull or bear market. Use Elliott Wave to time entries within that trend.
Key Takeaways
Previous: [Dow Theory: The Foundation of Technical Analysis](/dow-theory/)
Next: [The Wyckoff Method: Following Smart Money](/wyckoff-method/)
Get the daily framework intelligence
Trade the framework, not the noise.
The principles in this article are how we read markets every day. Members get the live application: daily Pre-Asia, Pre-London, Pre-NY and Post-Close briefs across 20+ instruments, the indicator suite, the Foundry library, and live community.
Free Explorer tier · No card required · Upgrade when you’re ready