Flow Intelligence Series
Flow Intelligence 01: Volume as a Leading Indicator
Price tells you what happened. Volume tells you whether anyone cared. That distinction is what separates a move worth following from noise that will reverse on you.
Why Volume Leads Price
Every price move requires a transaction. A buyer and a seller agreed on a price, and capital changed hands. Volume is the record of those transactions, and that record contains information that the price line alone cannot give you. When the number of transactions expanding, it means more participants are committing at that price level. When it contracts, fewer people are willing to act. That shift in participation often shows up in volume before it shows up in price.
This is why professional traders look at volume before they look at price action. If you see a price move developing and you simultaneously see participation increasing, you have two pieces of evidence that a genuine shift is underway. If the price is moving but volume is absent, you have a move being generated by fewer and fewer participants. Those moves end. They end quickly, and when they reverse, the reversal is often sharp because the imbalance that built the move was never supported by real two-way activity.
The lag that makes volume a leading indicator is counterintuitive. Volume tends to peak before price peaks. The highest volume in an uptrend often prints not on the last push higher, but on a bar that closes well off its high. Participation is flooding in, but the close near the low of the bar tells you that sellers absorbed it. That distribution happens at high volume before the price turns lower. By the time the price starts falling, the smart money has already sold into the demand. The volume told you first.
Volume Confirmation and What It Actually Means
A price move is confirmed when the volume behind it matches the character of the move. An upside break through a significant level on expanding volume tells you that buyers were willing to pay higher prices in increasing numbers. That is genuine demand. The break is likely to hold and continue. The same upside break on declining volume tells you that the market moved through the level because sellers temporarily stepped back, not because buyers flooded in. Those breaks fail. They fail at a rate that should eliminate them from your traded universe entirely.
Volume confirmation applies in both directions. A sharp decline on heavy volume tells you that sellers are urgent and aggressive. Price is likely to continue lower because the aggression has not been absorbed. A decline on thin volume is different. It tells you that sellers are not especially interested in pushing price down from here. The path of least resistance may be higher. You are looking at a quiet drift rather than a genuine breakdown.
The distinction matters for your entry timing, your stop placement, and your target. A confirmed move on volume can be held through normal intraday noise because the participation backing the position is real. A move on thin volume needs to be treated differently: held loosely, exited at the first sign of reversal, because the foundation underneath it is not solid.
Climax Volume: When Participation Exhausts
Climax volume is the highest participation point in a trend, and it marks the moment when the trend is running out of fuel. It looks dramatic. A large candle, an enormous spike in volume, often arriving after a sustained move in one direction. The instinct of most traders is to follow it, because it looks like conviction. It is the opposite of conviction. It is exhaustion.
What happens at climax volume is that the final wave of participants who were convinced by the trend enters the market all at once. They are buying the top of a sustained uptrend, or selling the bottom of a sustained downtrend, because the move has finally become impossible to ignore. The institutions who drove the trend are on the other side. They are selling into the demand the latecomers are providing, or buying the panic the latecomers are selling into. The high volume is the handover. The trend ends at the moment the last buyer buys.
Recognising climax volume in real time is difficult, but there are reliable characteristics. It typically follows a period of accelerating price action. The bar that carries the climax volume often has a wide range but closes significantly away from its extreme, suggesting that the aggressive participation was absorbed by the opposing side. The volume on the following bar drops sharply. That contraction confirms that the fuel is spent.
Dry-Up Volume: The Quiet Before the Move
If climax volume signals the end of a trend, dry-up volume often signals the beginning of the next one. Dry-up volume is the contraction that follows a period of high activity and precedes a new directional move. When volume compresses to well below average, it means that the participants who wanted to trade that instrument at the current price have largely finished. The market is waiting.
The dry-up itself is not a signal. It is a condition. It tells you that the environment is coiling, that supply and demand are roughly balanced at current levels, and that when the balance shifts, the move that follows will be fast because there is no opposing activity to absorb it. The value of identifying dry-up volume is that it puts you on alert. You are watching for the expansion that will follow the contraction, and you are ready to act when it arrives.
Dry-up volume on a pullback within a trend is particularly reliable. If the primary trend is up and price pulls back on shrinking volume, sellers are not aggressive. They are taking some off the table at higher prices. The lack of volume on the pullback tells you there is no genuine selling pressure behind the retracement. When volume expands again on the resumption of the uptrend, you have a clean entry with well-defined risk at the pullback low.
The Volume-Before-Breakout Tell
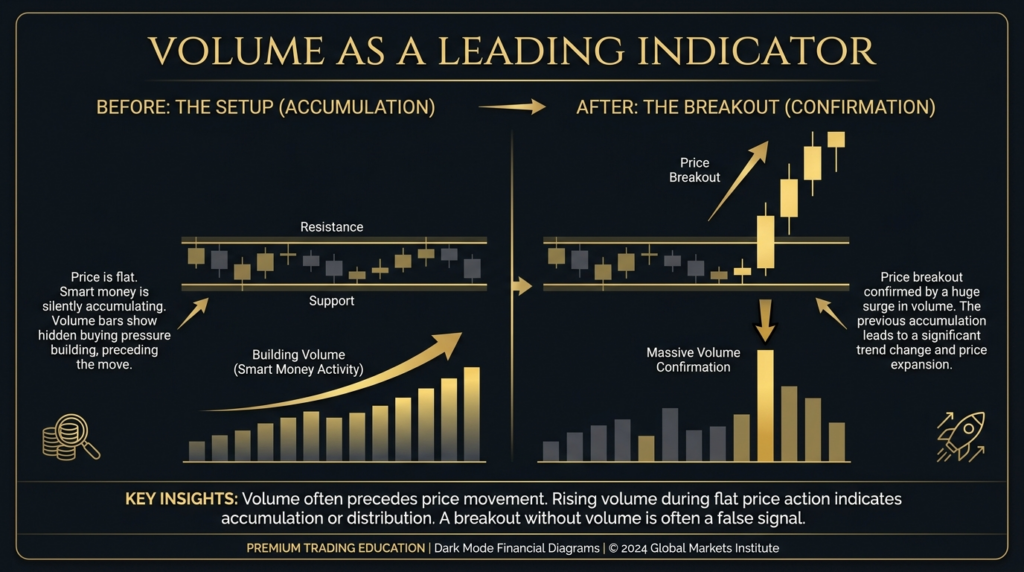
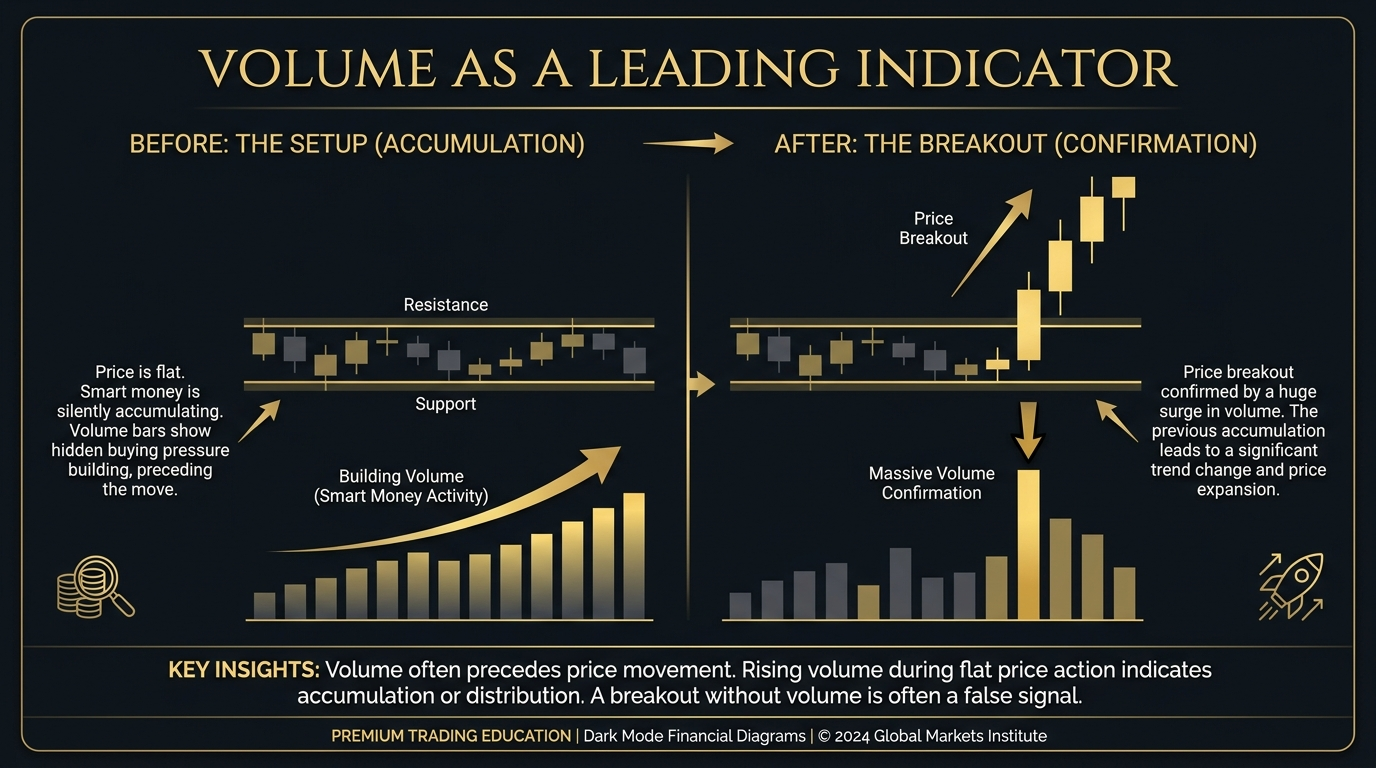
One of the clearest volume signals is the one that builds before a breakout. When an instrument is coiling near a significant level and volume begins to increase before the price breaks, it tells you that large participants are already positioning. They are not waiting for confirmation. They are accumulating before the price moves, because waiting for confirmation means paying a worse price.
This shows up as a series of bars with gradually increasing volume while the price range remains compressed. The price is not breaking out yet. But the activity underneath it is growing. When the breakout finally comes, it will have participation behind it before the crowd notices it has happened. The volume-before-breakout tell is the equivalent of watching someone put on a coat before the weather changes. The coat is on before the rain starts. The positioning is in place before the price moves.
Conversely, if a price reaches a significant level on declining volume with no accumulation visible, the breakout, if it comes, is suspect. The lack of volume-before means no one was pre-positioning for the move. The participants pushing price through the level are likely to be breakout traders acting on the price signal alone, without institutional backing. Those breaks fail. Wait for the volume.
Reading Volume Without Indicators
You do not need a volume indicator to read volume. The raw histogram at the bottom of any chart is sufficient for most of what matters. Train your eye to see the relative relationship between bars, not the absolute numbers. A bar twice the average height represents double the normal participation. A bar at half the average represents thin conditions. A series of bars declining from high to low represents a participation contraction. A bar that is dramatically larger than all surrounding bars warrants immediate attention.
Compare volume to the typical range for that session and instrument. The first hour of the New York session will always carry more volume than the lunch session. Comparing a lunch bar to the opening range bar tells you nothing. Compare it to other lunch bars from recent days. The relationship to its own context is what matters.
| Volume Pattern | What It Signals | Timing | Action |
|---|---|---|---|
| Expanding on trend | Genuine participation. Move likely to continue. | During a move | Hold position, follow momentum |
| Contracting on pullback | Shallow retracement. No aggressive opposing flow. | During retracement | Look for resumption entry |
| Climax spike, close off extreme | Exhaustion. Absorption of final wave. | End of trend | Reduce exposure, watch for reversal |
| Dry-up near level | Coiling. Breakout or breakdown approaching. | Pre-breakout | Tighten attention, prepare entry plan |
| Rising volume, flat price | Pre-breakout accumulation. Large players positioning. | Before breakout | Watch the level for directional break |
| Breakout on thin volume | Suspect move. No institutional backing. | During break | Wait for volume confirmation before entry |
Action Items
- Before every trade, look at the volume on the bar or bars driving the setup. Is it above or below average? Above means the participation is real. Below means it is not worth acting on yet.
- Review your last 15 losing trades and check the volume at entry. Estimate what percentage had below-average volume at the point you entered. That proportion is your thin-volume loss rate, and eliminating those entries is an immediate improvement to your results.
- Find a recent trend in any instrument you trade and identify the climax bar. Note the close relative to the range. Note the volume on the following bar. Practise seeing this pattern before it resolves so you can recognise it in real time.
- Spend one session watching a single instrument without trading. Track every time volume expands and note what price does in the following two to three bars. Build a reference library of what expansion looks like on your specific instrument.
- For the next month, require that any breakout entry you take must show a minimum of one and a half times average volume on the breakout bar or the bar immediately before it. Track whether this filter improves the quality of your breakout trades.
Continue Learning
- Flow Intelligence 02: The Volume-Price Relationship
- Flow Intelligence 03: Identifying Institutional Footprints
- Flow Intelligence 04: Flow Divergences That Matter
- Flow Intelligence 05: Liquidity Zones and Smart Money
- Predictive Edge 01: Confluence