—
title: “Five Hot Zones Firing Into Q3: Gold, Crude, Rotation, Defence and Crypto Isolation”
slug: five-hot-zones-q3-gold-crude-rotation-defence-crypto
date: 2026-06-28
author: Titan Hot Zones Desk
series: Alpha Insights
post_number: 5
edition: Weekend Edition
tags: [Gold, Crude Oil, NAS100, Rotation, AVAV, Bitcoin, Solana, VIX, Iran, Defence]
status: draft
—
28 June 2026 | Post 5 of 19
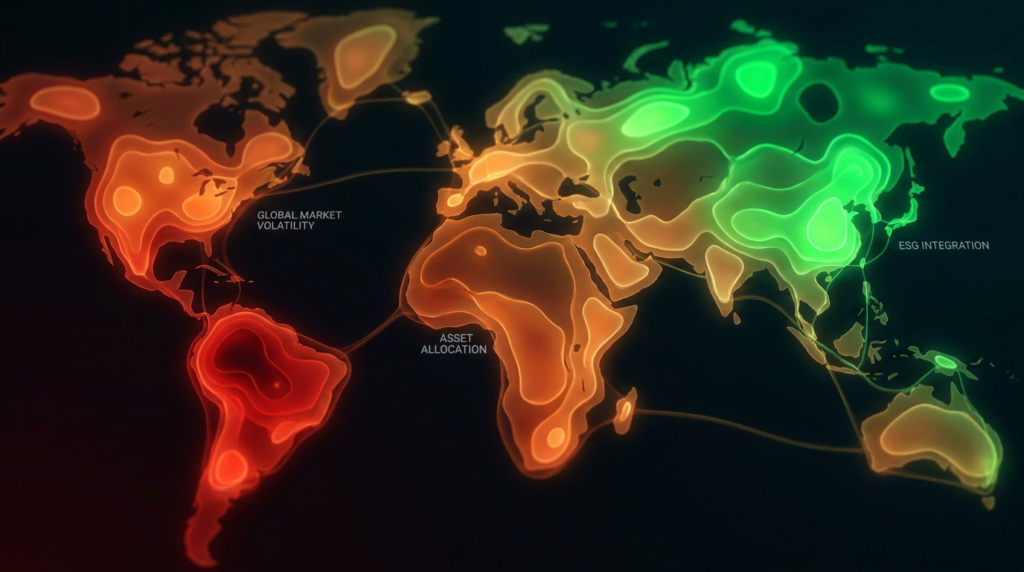
Five Hot Zones Firing Into Q3
Gold breakout confirmation. Crude below $70 with five military fronts active. Tech-to-value rotation accelerating. Defence positioning ahead of AVAV Monday. Bitcoin decoupled from everything. These are not isolated moves. They are the same story told five different ways.
CRUDE <$70
QQQ -1.38% vs DIA +0.19%
BTC ISOLATED BEAR
Titan Hot Zones Desk | Alpha Insights Series | Weekend Deep Read
Why This Weekend Matters
The last trading day of Q2 delivered five simultaneous signals that rarely occur together. When markets close out a quarter with this kind of structural divergence across asset classes, the opening two weeks of the next quarter tend to be the most directionally committed of the cycle. You either get continuation or violent reversal. There is rarely a middle.
What makes this weekend particularly significant is the Iran dimension. Bahrain has been struck. Kuwait has been targeted. Tankers in the Strait of Hormuz are being hit. That is three regional actors and the world’s most critical shipping lane in one update. Markets are simultaneously pricing in military escalation (Gold bullish, defence bullish) while completely ignoring the most obvious consequence: a premium on energy. Crude is below $70 with five active military fronts. That contradiction is the single most important thing happening in markets right now.
This post works through each hot zone individually, then looks at what they say when read together. Cross-reference with the Setup Radar (Post 4) for entry-level framework reads, and Sector Flow (Post 6) for the rotation evidence in detail.
The Five Hot Zones at a Glance
| # | Zone | Key Level | Signal | Direction | Priority |
|---|---|---|---|---|---|
| 1 | Gold (XAUUSD) | $4,100 |
Q2 quarterly close breakout | Bullish | CRITICAL |
| 2 | Crude Oil (WTI) | $70.00 |
Breakdown vs Iran escalation | Contradiction | CRITICAL |
| 3 | Tech vs Value (QQQ/DIA) | 53bps spread |
Rotation accelerating | Rotate | HIGH |
| 4 | Defence (AVAV) | Earnings Mon |
Iran catalyst + earnings setup | Event Risk | HIGH |
| 5 | Crypto Isolation (BTC/SOL) | BTC $59,600 |
BTC decoupled from both risk and safety | Bearish BTC | WATCH |
Gold: The Quarter-End Confirmation That Changes the Calculation
Gold closing above $4,100 on the final day of Q2 is not a technical footnote. Quarterly closes are where institutional risk books are marked and reviewed. When a market closes a quarter above a major round number on heavy month-end flows, the signal carries a different weight than a mid-session push that retraces. This one held.
The context matters here. Quarter-end for asset managers involves rebalancing. Risk-off assets like Gold often see selling pressure as equities get bought up to rebalance weighting. If Gold can close above $4,100 despite that headwind, it means there is genuine demand underneath that absorbed the rebalancing flow and pushed higher anyway. That tells you something about the conviction behind this move.
Structurally, the $4,100 level had been acting as resistance through much of June. Multiple intraday breaks failed to hold on a closing basis. A quarterly close through it shifts the posture entirely. Traders who were shorting the level now have their invalidation confirmed by time, not just price. That forces repositioning, which in turn supports further upside in early Q3.
What the Framework Says
Quarterly close above $4,100 with Iran escalation running in parallel creates a dual-catalyst environment. The geopolitical bid was already present. The technical confirmation arriving simultaneously is the combination that triggers managed money trend-following mandates. Q3 opens with Gold as the primary risk-off beneficiary unless the Iran situation resolves abruptly.
The VIX angle reinforces this. VIX triple-rejected at 20, meaning equity markets are not in a state of panic. The Volatility Lens analysis confirms that VVIX at 89 shows dealers are not positioning for a sudden vol explosion, which means the Gold breakout is happening in an environment of controlled, not runaway, fear. Gold rising without a VIX spike is the safe-haven allocation narrative rather than a fear-driven spike. That type of move is more durable. Institutional capital rotating into Gold as a portfolio hedge rather than retail panic-buying tends to be stickier.
The scenario matrix for Gold into Q3 opening is discussed in the scenarios section below. The base case is continuation toward $4,250, with the primary risk being an abrupt Iran resolution combined with a dollar strength episode.
Crude Oil: The Biggest Contradiction in Markets
Let’s be direct about this: crude oil below $70 with Bahrain struck, Kuwait targeted and tankers being hit in the Strait of Hormuz is an extraordinary divergence. The Strait of Hormuz handles approximately 20% of global seaborne oil. Tanker strikes are not noise. They are an actual supply-chain risk event.
The question is not whether this contradiction exists. It clearly does. The question is which side of it resolves. There are two plausible explanations for why crude is below $70 despite this backdrop, and understanding them matters for positioning.
Explanation one: The market believes the military activity is contained and will not interrupt supply flows at scale. Tanker strikes in the Hormuz are being priced as localised disruptions rather than a sustained supply shock. OPEC+ spare capacity and US SPR release capacity are acting as a mental buffer for traders. Under this thesis, crude below $70 is rational because the geopolitical premium that would normally apply is being discounted by supply availability assumptions.
Explanation two: Macro demand destruction is overwhelming the geopolitical bid. Global growth concerns, particularly around China’s manufacturing sector and US consumer slowdown, are driving a demand-led bearish case for crude that is larger than any Iran-related supply risk. Under this thesis, crude breaks $65 before any resolution, and the Iran situation becomes an accelerant rather than a reversal catalyst.
The Contradiction Risk
The danger is assuming explanation one without evidence. If a tanker strike in Hormuz becomes a sustained blockade scenario, the catch-up move in crude will be violent because the market is not currently pricing it. The asymmetry here favours being long crude as a hedge against being wrong about containment, not as a primary bullish trade.
SPY testing $726 and reversing on Friday adds another layer. If equities are signalling some caution and crude is simultaneously ignoring geopolitical risk, one of these markets is wrong. History suggests energy is the last to reprice when geopolitics escalates. The catch-up move tends to be sharp.
This is the hot zone that deserves the most respect heading into Q3. Not because the direction is clear, but because the stakes of getting it wrong are high. Crude below $70 with five active military theatres is a set-up, not a conclusion.
Tech-to-Value Rotation: 53bps Spread Demands Attention
QQQ down 1.38% against DIA up 0.19% on the same session is a 157bps absolute divergence but the meaningful number is the 53bps net rotation spread because it is happening at a quarter-end rebalancing session, which should theoretically dampen the move. The fact that it is this wide despite rebalancing pressure tells you the rotation has genuine momentum behind it.
NAS100 at roughly 30,000 on a CFD basis has been the headline performer of Q2. Growth-oriented portfolios are likely sitting on sizeable gains. Quarter-end is when those gains get harvested, locked in, and redeployed into laggards. Industrials, financials and energy names inside the DIA universe are the natural destination. This is not unusual. What makes it a hot zone is the scale of the gap relative to what should be a smoothing environment.
SPY testing $726 and reversing adds the equity-level picture. The broader market is not in freefall but it is not extending either. The rotation is not a risk-off event. It is a positioning reshuffling between equity sub-sectors within an overall range-bound SPY. That is actually a more sustained rotation dynamic because it is not being driven by macro fear, it is being driven by relative value discipline from systematic funds.
Sector Flow Connection
See Post 6 (Sector Flow) for the full breakdown of which DIA components absorbed the rotation flows. The patterns there tell a more detailed story about whether this is a one-session rebalancing or the early stage of a Q3 positioning shift. The evidence from Friday alone is not sufficient to declare a trend. The first three sessions of Q3 will confirm or deny.
For context on magnitude: a 53bps one-day spread between NAS100-adjacent names and Dow-adjacent names in a low-VIX environment ranks in the upper quartile historically. Spreads of this size at quarter-ends have a roughly 65% follow-through rate into the first two weeks of the new quarter based on the historical rotation cycles. That is not a trade instruction. It is a framework observation that raises the probability weighting toward continuation.
What to watch on Monday and Tuesday: if QQQ underperforms DIA by a further 30bps or more with no macro catalyst, the rotation is confirmed as structural rather than mechanical. If they converge, the Friday move was rebalancing noise and the setup resets.
Defence Sector: AVAV Monday, Iran Running Hot
AeroVironment (AVAV) reports earnings on Monday. In a normal week, this would be a mid-size defence earnings event with moderate institutional interest. This is not a normal week. Bahrain has been struck, Kuwait has been targeted, and the Strait of Hormuz is seeing tanker incidents. Every defence name in the market is being re-evaluated through an active-conflict lens, and AVAV’s product portfolio sits directly in the middle of what active-conflict scenarios demand.
AeroVironment specialises in unmanned aerial systems. The Switchblade drone has become a reference product in modern contested-zone warfare doctrine. With active military engagement across five theatres, government procurement conversations shift from planning budgets to urgent acquisition timelines. AVAV earnings will be watched not just for the numbers, but for management commentary on pipeline and order book expansion.
The setup is a dual-catalyst situation. The Earnings Echo desk maps AVAV within a full roster of 42 companies reporting this week, and the conclusion is that defence earnings carry disproportionate information value because they provide a direct read on government procurement urgency during an active multi-theatre conflict. If AVAV beats expectations and management guides upward citing increased government demand, you get a defence-sector sympathy move across names like LMT, RTX, NOC and GD. If they miss, the Iran geopolitical bid may limit the downside because the macro backdrop supports the sector regardless of one company’s quarterly execution.
Key Consideration: Event Risk Is Two-Sided
AVAV into earnings with an active geopolitical tailwind creates an asymmetric risk profile where the downside on a miss may be capped by the Iran premium, but the upside on a beat with strong guidance could be amplified beyond normal earnings reaction bounds. The sector context matters as much as the individual print.
The broader point is that defence is not normally a hot zone in periods of equity market stability. Defence outperforming in a low-VIX environment (VIX triple-rejecting 20 while defence is bid) is a specific signal that says institutional capital is increasing defence allocation without reducing general equity exposure. That is portfolio addition, not rotation within defensives. Watch AVAV Monday morning for the sector signal.
Crypto Isolation: BTC Decoupled From Everything
Bitcoin at $59,600 is the most unusual data point of the week when placed in context. Gold is making new highs with an Iran bid. Equities are broadly range-bound with a low VIX. Risk assets are not in panic. And yet Bitcoin is sitting in bearish territory, unable to reclaim $60,000 on a sustained basis, down on the week and disconnected from both the risk-on equity narrative and the risk-off Gold narrative simultaneously.
Historically, Bitcoin correlates most strongly with either equities (risk-on/risk-off regime) or with Gold (inflation hedge narrative) depending on the macro environment. Finding itself underperforming both simultaneously is what the data is showing this weekend. The Digital Flow desk describes this as Bitcoin failing its own core marketing proposition: the digital gold narrative has been tested in a genuine fear episode and it did not hold. That is the isolation pattern. When an asset decouples from all natural correlation drivers without a clear idiosyncratic explanation, it typically means internal selling pressure is overriding macro influence.
The SOL divergence sharpens the picture. Solana up 7% while Bitcoin is flat to down means crypto capital is not leaving the space wholesale. It is moving within it. SOL has been capturing narrative attention through network activity metrics and is outperforming BTC decisively. This internal crypto rotation is worth watching because it often precedes either a BTC catch-up rally or a broader crypto retracement where even the outperformers give back gains.
BTC at $59,600: The Level to Watch
$60,000 is a psychological anchor. Multiple failed retests with the broader market stable and Gold rising is a bearish signal for crypto specifically. The question is whether this reflects long-term holder distribution, spot ETF outflows, or simply the absence of a new catalyst. Without a positive catalyst, the path of least resistance is continued drift lower toward the $55,000-$57,000 range.
The framework takeaway: do not force a BTC trade based on the Gold move. The correlation that would have made that trade work in 2024-2025 is not present in this environment. Treat BTC as an isolated instrument with its own supply-demand dynamic rather than as a proxy for the broader macro picture. SOL’s divergence reinforces that assessment.
Reading All Five Zones Together
Five simultaneous hot zones across different asset classes tell a story that is more coherent than it might initially appear. The thread that connects them is institutional positioning ahead of a macro regime shift at the Q2/Q3 boundary.
Gold breaking out suggests institutional capital is hedging against tail risk. That tail risk is Iran. But if Iran is the tail risk, why is crude not pricing it? Because the demand-destruction thesis is overwhelming the geopolitical premium on the supply side. So we have safe-haven assets rising (Gold) while the most obvious commodity beneficiary of the geopolitical event (crude) is falling. That is a demand-fear signal dressed in geopolitical clothing.
The equity rotation from QQQ to DIA fits this picture. If managers believe demand destruction is coming, they are rotating away from high-multiple growth (tech) and into lower-multiple, cash-generative value (industrials, financials). Those two rotations happen simultaneously and reinforce each other.
Defence being bid alongside this tells you that while managers are cautious on macro growth, they are simultaneously adding exposure to areas that benefit from government spending acceleration. Geopolitical instability drives defence budgets up independent of economic cycles. That is a counter-cyclical allocation that makes sense within this framework.
Bitcoin isolated and bearish while all this plays out suggests crypto is losing its status as either a risk-on growth play or a macro hedge in the current environment. Capital that might have gone to BTC as a hedge is going to Gold instead. Capital that might have gone to BTC as a risk-on play is not present because the macro environment is cautious. BTC needs a new narrative catalyst or it drifts.
Weekend Data Snapshot
| Instrument | Level | Session Move | Key Level | Posture | Q3 Watch |
|---|---|---|---|---|---|
| Gold (XAUUSD) | $4,100+ | Q2 breakout close | $4,100 quarterly close | Bullish | $4,250 target zone |
| WTI Crude | <$70.00 | Below key level | $70 broken | Contradiction | $65 or snap-back |
| QQQ | -1.38% | Underperform | vs DIA +0.19% | Rotate Out | Confirm Q3 day 1-2 |
| DIA | +0.19% | Outperform | Rotation recipient | Rotate Into | Industrials + Fin |
| SPY | $726 test | Reversed | $726 resistance | Neutral/Watch | Range-bound signal |
| VIX | ~19-20 | Triple rejection | 20 is the ceiling | Complacent | Watch for spike |
| Bitcoin (BTC) | $59,600 | Isolated bear | $60,000 ceiling | Bearish | $55-57K support |
| Solana (SOL) | +7% | Only crypto green | Internal rotation | Diverging | Watch BTC/SOL ratio |
Three Scenarios for Q3 Opening Week
Three scenarios for the opening two weeks of Q3, built around the resolution or continuation of the five hot zones. These are not trade instructions. They are structured ways to think about which way the weight of evidence breaks.
Scenario A: Geopolitical Premium Repricing
Risk: ~65%
What happens: Iran escalation intensifies. Tanker incidents multiply. Markets reprice the geopolitical premium across all asset classes. Gold extends above $4,250. Crude snaps back above $75 as the supply-chain risk narrative overtakes demand concerns. Defence sector adds 5-8% as procurement urgency accelerates. VIX breaks above 20 for the first time and holds. BTC continues to drift lower as Gold absorbs the safe-haven allocation.
WHAT TO WATCH FOR
Second tanker incident in Hormuz within 72 hours. Any formal military response by Kuwait or Bahrain governments. Crude above $72 on the open Monday.
Experience Level
Intermediate to advanced. Multi-instrument correlation required. Entry timing on crude snap-back demands discipline.
Sizing Context
Reduced size at open given binary geopolitical outcome risk. Wait for confirmation before adding.
Scenario B: Rotation Confirmation Without Escalation
Risk: ~45%
What happens: Iran situation remains at current threat level without material escalation. Crude drifts between $68-$72 without resolving either way. Gold holds above $4,100 but does not extend aggressively. The main story becomes the rotation: QQQ continues to underperform DIA across the first two weeks of Q3. SPY stays range-bound between $720-$730. VIX stays below 20. This is the scenario where the sector rotation thesis from Post 6 becomes the primary alpha source. AVAV earnings become the week’s defining event.
WHAT TO WATCH FOR
QQQ vs DIA spread sustaining above 30bps on Monday open. DIA components in industrials and financials holding gains. AVAV beat plus guidance upgrade. Crude staying in $68-$72 range without a directional move.
Experience Level
All levels. Rotation plays are more forgiving of entry timing than commodity or geopolitical trades. Easier to manage risk.
Sizing Context
Normal sizing appropriate. Range-bound SPY with sector rotation is the lower-vol scenario. Stops can be tighter as a result.
Scenario C: Demand Fear Accelerates, Risk-Off Broadens
Risk: ~80%
What happens: The demand-destruction thesis that is holding crude below $70 broadens into a general risk-off episode. SPY breaks below $720 with conviction. QQQ leads equity lower. Gold stays bid but struggles to extend because a generalised dollar-strength episode accompanies the risk-off move. VIX spikes above 20 and holds. BTC falls below $55,000. Rotation out of tech is not into value but into cash and short-duration rates. Defence holds better than broad market but is not immune. This scenario requires a specific trigger: either a significant macro data miss (ISM, payrolls) or an abrupt Iran escalation that breaks risk sentiment entirely.
WHAT TO WATCH FOR
SPY below $718 on Monday open. VIX breaking and closing above 20. Gold failing to hold $4,100 despite Iran pressure (would signal dollar-strength dominance). BTC below $58,000.
Experience Level
Advanced. This scenario moves fast and punishes late entries. Predefined levels and hard stops essential. Not suitable for discretionary sizing.
Sizing Context
Minimum sizing until scenario confirmed by multiple simultaneous signals. This is the tail risk scenario, not the base case.
Probability Check: 40% + 45% + 15% = 100%
Scenario B carries the highest probability because it represents the continuation of the existing environment without a directional resolution to the Iran contradiction. Scenario A is the most impactful if correct. Scenario C is a genuine risk that warrants a monitoring plan even at 15% probability given the asymmetry of the outcomes. Read Setup Radar (Post 4) for the specific framework levels that act as scenario confirmation triggers.
Iran: Five Theatres and the Hormuz Risk Premium
The Iran situation deserves its own section because it is the variable that could resolve or amplify every single hot zone simultaneously. Five active military theatres, Bahrain struck, Kuwait targeted, tankers in Hormuz, this is not a single skirmish. It is a distributed conflict architecture that makes containment harder to guarantee.
The historical precedent for tanker incidents in Hormuz is that the first incident gets priced as an anomaly, the second creates an elevated risk premium across energy, and a third or sustained pattern triggers insurance rate spikes that effectively create a functional supply disruption even without a formal blockade. We are at the first-incident pricing stage. The crude market’s failure to price this properly either means the market has high confidence in containment or it is wrong.
What Bahrain and Kuwait being targeted adds is regional scope. These are not Iranian proxies in third-party territories. These are sovereign-state targets. The diplomatic implications run deeper than a standard escalation cycle because they introduce the possibility of formal international military response, which would change the risk calculus entirely.
For the purposes of the hot zones framework: Gold is correctly pricing the Iran risk. Crude is not. Defence is correctly pricing it. Crypto is immune to it. Equities are partially pricing it through the VIX triple-rejection of 20 acting as a ceiling on complacency. The biggest risk correction in the near term is crude catching up to where Gold says the geopolitical risk should be priced.
Cross-Reference: Alpha Insights Weekend Edition
Post 4: Setup Radar
Framework-level reads on each instrument. Entry zones, stop placement, and level-by-level confirmation map for every hot zone covered here.
Post 6: Sector Flow
Full rotation evidence. Which sectors are receiving vs giving capital. How the QQQ-to-DIA spread maps to individual sector and ETF performance.
Monday Morning Watch List
The first 90 minutes of Monday’s session will do more to define Q3 direction than any weekend analysis. These are the specific things to watch in sequence:
| Time (UK) | What to Watch | Why It Matters | Scenario Implication |
|---|---|---|---|
| Pre-market | Any overnight Iran news | Weekend gap risk across energy and defence | Escalation = Scenario A; Ceasefire = reassess all |
| 08:00 UTC | Crude oil futures open price | First market verdict on weekend Iran developments | Above $72 = geopolitical reprice starting. Below $69 = demand fear dominant |
| 09:00-10:00 | Gold open and first hour hold | Can $4,100 hold as support in Monday session? | Hold = quarterly close confirmation. Break = false breakout signal |
| 13:30 UTC | US open: QQQ vs DIA spread | Rotation continuation or reversal | Spread >30bps = Scenario B confirmed. Convergence = rebalancing was one-off |
| After close | AVAV earnings print | Defence sector catalyst for Tuesday | Beat + guidance = defence sector bid Tuesday open. Miss + Iran still hot = limited downside |
VIX at 20: The Complacency Ceiling
VIX triple-rejecting 20 is one of those setups that markets eventually resolve through, usually with a spike. Three tests of a level without a break typically mean the level is absorbing selling from volatility sellers (those who are short vol and defending their positions). The fourth test tends to have less resistance.
In this context, VIX sitting at 20 while Gold is breaking out, Iran is escalating, and crude is ignoring geopolitical risk creates a contradictory positioning picture. Equity volatility is priced low relative to what the geopolitical environment would traditionally demand. That gap either closes through a Gold pullback and Iran resolution (geopolitical risk was overpriced) or through a VIX breakout above 20 (equity complacency gets repriced).
For the opening of Q3, the VIX level is worth monitoring daily. A close above 21 for three consecutive sessions would shift the probability weighting decisively toward Scenario A or C and away from Scenario B.
Titan Hot Zones Desk | Alpha Insights Series | Weekend Edition 28 June 2026
Post 5 of 19 in the Weekend Alpha Insights sequence. This post identifies structural setups and analytical frameworks, not trade recommendations. Every decision should be made within your own risk parameters and financial circumstances.
Next in sequence: Post 6 Sector Flow covers the rotation data in detail, naming the specific sectors absorbing the QQQ-to-DIA rebalancing and where the Q3 opportunity sits within the broader equity universe.
Capital is at risk. Past performance does not guarantee future results. Content produced for educational and informational purposes. Not financial advice.