Positioning political buying, disclosed 2026-09-04
Options put/call open interest 2.37, read 2026-11-01
Ethical passes the values gate
Price504.80 USD
Fair value387.45
Ethical score90.2/100
RatingOVERVALUED
Our investment reviews on this name
2026-10-25Read Distribution562.23-10.2% to today ✓Markup gives way to Distribution after an 11% slide in 3 weeks
2026-10-02Read Markup630.63-20.0% to today Distribution gives way to Markup after a 34% rise in 4 weeks
2026-09-03Read Distribution469.46+7.5% to today Markup gives way to Distribution with results news in the headlines
2026-07-02Read Markup466.38+8.2% to today ✓First review on file: Markup
Our analytic regime reads on this name, dated and marked against the screened price. Small sample per name, and separate from the daily-framework accuracy on the Track Record page.
Every chart read we post on this name lands here. Each one says which way we lean, how firmly, and the line that would prove us wrong. When price settles a read, we add a new entry and say plainly how it went.
Entries are point-in-time and never edited. Times in UTC. Not advice.
31 Oct06:26 UTC
UpdateDaily chartHeld
Updates the daily read of 28 Oct, 09:36 UTC. Friday low 492.24, close 504.80, over the 502.60 line. The 538.50 failure sign has triggered. Results 3 Nov. See that read ↓
Update on AMD. This one is hanging by a thread. Wednesday reached 579.18, just short of 581, then Friday dropped to 492.24 and closed at 504.80. That close is under 538.50, which I said would mean the bounce failed, but still over 502.60, the line that makes the read wrong. Results are due on 3 Nov. A daily close under 502.60 ends the up read. Does 502.60 hold into the report? Not financial advice.
28 Oct09:36 UTC
ReadDaily chartHeld
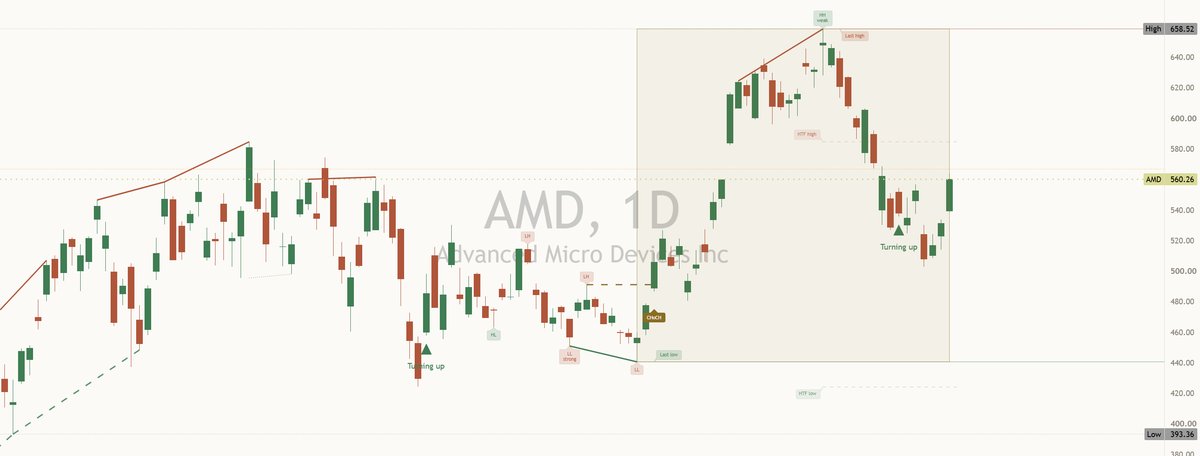
AMD bounces to 560.26 over 556.79, can it hold into earnings?
↑
Up · slight
Wrong if a daily close lands under 502.60.
Cleared556.79
Bounce low538.50
20-day avg581.03
Next up639.00
Floor502.60
AMD closed Tuesday at 560.26, up 5.5% on the day and 11% off the 502.60 low from 22 Oct. That close is over 556.79, the 21 Oct high, so the bounce has cleared the last lower high. It is still about 15% under the 658.52 high from 6 Oct, and under its 20-day average at 581.03. It is over its 50-day (543.70) and 200-day (405.50) averages, and the weekly chart is still up. The big range (about 30 points a day) means the read is only slight.
Risk event: earnings are expected on 3 Nov (yfinance estimate, six days away). Gaps over earnings can skip every level.
If it goes up (most likely, but only slightly). A daily close over 581, the 20-day average, would add to the bounce. The next dated level is 639.00, the 25 Sep high, then 658.52.
If it goes down (less likely). A daily close under 538.50, Tuesday's low, would say the bounce failed. A close under 502.60 would put the October low back in play.
If it chops. Price moves between 538.50 and 581 into the results. Nothing to do in the middle. Let price come to the levels.
Is this a real turn or one strong day before the results? Not financial advice.
Updated 31 Oct, 06:26 UTC: held. Friday low 492.24, close 504.80, over the 502.60 line. The 538.50 failure sign has triggered. Results 3 Nov. This entry stays as written.
Chart as posted, 28 Oct 09:36 UTC. Daily candles to the 27 Oct close.
A read stays open until price settles it. Held and Hit mean the line we named did its job. Wrong means it did not. Grey means nothing triggered.
Also posted on our social channels.
The full research record, in depth, below
The Label · The Season, Not the Day
This name holds its distribution label.
Advanced Micro Devices holds its Distribution at $504.80. The statistical read favours the sellers, held for 45 days.
As held on the ledger · 2026-10-30
Phase
Distribution · caution
Quantitative state
The statistical read favours the sellers, held for 45 days
Price at the screen
$504.80
Valuation
144.49 trailing · 35.61 forward price to earnings
Values screen
PASS· score 90.2
Beta
2.45
The Workings
Five Screens, Shown in Full
Full pass across all five screens. This security clears the Titan Ethical Standard: its business and its balance sheet both stay inside the lines.
Test
Figure
Limit
What it means
Status
Business activity
Permissible
Core business clean
Its core business isn't built on prohibited lines: no gambling, alcohol, tobacco, weapons, or interest-based lending.
Pass
Debt load
5.00%
Below 33%
Interest-bearing debt is just 5.0% of its assets, well under the one-third ceiling: it does not run on borrowed money.
Pass
Interest-bearing cash
6.52%
Below 33%
Cash held in interest-bearing accounts and securities is 6.5% of assets, under the one-third limit.
Pass
Receivables
15.41%
Below 49%
Money owed to the company is 15.4% of assets, under the 49% limit.
Pass
Revenue purity
0.62%
Below 5%
Only 0.6% of revenue comes from non-compliant sources, under the 5% line.
Pass
Five checks adapted from AAOIFI screening standards: business activity plus four balance-sheet ratios. All five must pass for ethical clearance. Every figure is arithmetic on public accounts, not judgement.
The Ethical Read
Why It Clears, in Plain English
Advanced Micro Devices clears all five screens. Its business is in a permissible area, its interest-bearing debt is about 5%, inside the ~33% line, and almost none of its income is interest, so it passes.
Read as at 2026-11-01. It updates when the underlying figures move, and past reads are kept below.
Follow this verdict
Get an email when AMD's ethical verdict changes
Today AMD passes the screen. If new figures move it to a fail, we send you one short email with the before and after. Verdicts change rarely, so you may not hear from us for a long time.
Free, no account needed. Every email has a link to stop.
What the Numbers Say It Is Worth
The Fair Value Range
Our analysis reads OVERVALUED: it trades above our $387.45 fair value estimate, narrow competitive moat, 50.10% revenue growth.
Fair value range in USD, drawn from the 2026-10-30 screen. The gold marker is the market price at the same screen. The price runs 23.2% above the base estimate.
Third-party analyst targets: 50 covering, consensus Strong Buy. The average target sits +27% from the screen price.
Reading the gap · Our more conservative model reads it as fully-to-richly valued here, while the Street is more bullish: a quality-at-a-fair-price name rather than a deep-value one.
Where our models see it going: fair-value estimate $387.45, with a range of $328.50 to $445.57, dated to the 2026-10-30 screen.
Fair value and rating are our own model estimates; the Street's range reflects third-party analyst estimates. Analysis, not advice.
The Business, in Plain Words
AMD's High Valuation in a Cyclical Market
Imagine semiconductors as the engines of the digital age, and AMD is one of the key manufacturers. At its current price of $469.45, our fair value sits at $370.35, marking an overvaluation of -21%. Despite the sector's cyclical nature, AMD has been riding high on impressive revenue growth of 50% and a robust profit margin of 16%. However, investors must not overlook the cyclical value trap, where peak earnings can distort the true value, especially with AMD's relatively narrow moat.
Why AMD stands out is its consistent revenue growth and profitability, all while passing our ethical screen. The market consensus rating is a strong buy, with a median target price of $610, which is significantly higher than our fair value estimate. However, considering the cyclical industry's pitfalls, this might be a case where market optimism is ahead of prudent valuation.
Risk lies in the industry's inherent cyclicality. With a forward P/E of 30.4x and a ROE of 10%, investors might be paying a premium for growth that could be ephemeral in the cyclical semiconductor market. The high consensus target price suggests confidence, but given the cyclical nature of the sector, this enthusiasm might be misplaced. Analysis, not advice.
Another profit measure, before interest, tax and non-cash costs: EBITDA.
The risks · The things to watch: it already moves more than the market on an average day.
Plain-English interpretation of our own screen data. Analysis, not advice.
Where & How to Trade
AMD trades on a US exchange. As a listed security it is accessible through almost any international broker offering its home market. New to this, or investing from abroad? Our guide to accessing global markets covers brokers, currencies and the practical steps.
The Dated Journal · Newest First, Never Edited
Every Entry, As Written
2026-11-01Distribution$504.80+0.0%Entry 23
The analysis reads distribution. Smart money appears to be selling into strength. Institutional holders may be rotating out. Price has moved down 0.0% since our last review. Ethical screening: PASS with near-perfect ethical score. The risk-adjusted return profile shows good risk-adjusted returns. Our composite framework grades it D. Technically it is holding around 29% above its long-term trend line with momentum reading oversold. Over the past year the shares are up 266%. Our forward projection puts the odds of a 10% gain over the next month near 41%. The street (48 analysts) rates it strong buy, with a mean price target of $472. Insiders have been net sellers over the past quarter. It reported earnings in this window, a natural checkpoint for the thesis.
2026-10-31Distribution$504.80-10.9%Entry 22
The analysis reads distribution. Smart money appears to be selling into strength. Institutional holders may be rotating out. Price has moved down 10.9% since our last review. Ethical screening: PASS with near-perfect ethical score. The risk-adjusted return profile shows good risk-adjusted returns. Our composite framework grades it C. Technically it is holding around 29% above its long-term trend line with momentum reading oversold. Over the past year the shares are up 266%. Our forward projection puts the odds of a 10% gain over the next month near 41%. The street (48 analysts) rates it strong buy, with a mean price target of $472. Insiders have been net sellers over the past quarter. It reported earnings in this window, a natural checkpoint for the thesis.
2026-10-30Distribution$566.42-2.1%Entry 21
The analysis reads distribution. Smart money appears to be selling into strength. Institutional holders may be rotating out. Price has moved down 2.1% since our last review. Ethical screening: PASS with near-perfect ethical score. The risk-adjusted return profile shows good risk-adjusted returns. Our composite framework grades it C. Technically it is holding around 29% above its long-term trend line with momentum reading oversold. Over the past year the shares are up 266%. Our forward projection puts the odds of a 10% gain over the next month near 41%. The street (48 analysts) rates it strong buy, with a mean price target of $472. Insiders have been net sellers over the past quarter. It reported earnings in this window, a natural checkpoint for the thesis.
2026-10-29Distribution$578.44+2.9%Entry 20
The analysis reads distribution. Smart money appears to be selling into strength. Institutional holders may be rotating out. Price has moved up 2.9% since our last review. Ethical screening: PASS with near-perfect ethical score. The risk-adjusted return profile shows good risk-adjusted returns. Our composite framework grades it C. Technically it is holding around 29% above its long-term trend line with momentum reading oversold. Over the past year the shares are up 266%. Our forward projection puts the odds of a 10% gain over the next month near 41%. The street (48 analysts) rates it strong buy, with a mean price target of $472. Insiders have been net sellers over the past quarter. It reported earnings in this window, a natural checkpoint for the thesis.
2026-10-28Distribution$562.23+0.0%Entry 19
The analysis reads distribution. Smart money appears to be selling into strength. Institutional holders may be rotating out. Price has moved down 0.0% since our last review. Ethical screening: PASS with near-perfect ethical score. The risk-adjusted return profile shows good risk-adjusted returns. Our composite framework grades it C. Technically it is holding around 29% above its long-term trend line with momentum reading oversold. Over the past year the shares are up 266%. Our forward projection puts the odds of a 10% gain over the next month near 41%. The street (48 analysts) rates it strong buy, with a mean price target of $472. Insiders have been net sellers over the past quarter. It reported earnings in this window, a natural checkpoint for the thesis.
2026-10-27Distribution$562.23+0.0%Entry 18
The analysis reads distribution. Smart money appears to be selling into strength. Institutional holders may be rotating out. Price has moved down 0.0% since our last review. Ethical screening: PASS with near-perfect ethical score. The risk-adjusted return profile shows good risk-adjusted returns. Our composite framework grades it C. Technically it is holding around 29% above its long-term trend line with momentum reading oversold. Over the past year the shares are up 266%. Our forward projection puts the odds of a 10% gain over the next month near 41%. The street (48 analysts) rates it strong buy, with a mean price target of $472. Insiders have been net sellers over the past quarter. It reported earnings in this window, a natural checkpoint for the thesis.
The framework has shifted from markup to distribution since the last review. Smart money appears to be selling into strength. Institutional holders may be rotating out. Price has moved down 0.0% since our last review. Ethical screening: PASS with near-perfect ethical score. The risk-adjusted return profile shows good risk-adjusted returns. Our composite framework grades it C. Technically it is holding around 34% above its long-term trend line with momentum reading oversold. Over the past year the shares are up 266%. Our forward projection puts the odds of a 10% gain over the next month near 41%. The street (48 analysts) rates it strong buy, with a mean price target of $472. Insiders have been net sellers over the past quarter.
2026-10-18Markup$562.23-10.8%Entry 16
The analysis reads markup. Price is trending higher with momentum. The crowd has caught on and buyers are in control. Price has moved down 10.8% since our last review. Ethical screening: PASS with near-perfect ethical score. The risk-adjusted return profile shows good risk-adjusted returns. Our composite framework grades it B. Technically it is holding around 117% above its long-term trend line with momentum reading overbought. Over the past year the shares are up 266%. Our forward projection puts the odds of a 10% gain over the next month near 41%. The street (48 analysts) rates it strong buy, with a mean price target of $472. Insiders have been net sellers over the past quarter.
2026-10-11Markup$630.63+0.0%Entry 15
The analysis reads markup. Price is trending higher with momentum. The crowd has caught on and buyers are in control. Price has moved down 0.0% since our last review. Ethical screening: PASS with near-perfect ethical score. The risk-adjusted return profile shows good risk-adjusted returns. Our composite framework grades it A. Technically it is holding around 117% above its long-term trend line with momentum reading overbought. Over the past year the shares are up 266%. Our forward projection puts the odds of a 10% gain over the next month near 41%. The street (48 analysts) rates it strong buy, with a mean price target of $472. Insiders have been net sellers over the past quarter.
2026-10-02Markup · changed$630.63+34.3%Entry 14
The framework has shifted from distribution to markup since the last review. Price is trending higher with momentum. The crowd has caught on and buyers are in control. Price has moved up 34.3% since our last review. Ethical screening: PASS with near-perfect ethical score. The risk-adjusted return profile shows excellent risk-adjusted returns. Our composite framework grades it B. Technically it is holding around 117% above its long-term trend line with momentum reading overbought. Over the past year the shares are up 266%. Our forward projection puts the odds of a 10% gain over the next month near 41%. The street (48 analysts) rates it strong buy, with a mean price target of $472. Insiders have been net sellers over the past quarter. Since the last review it its composite score eased.
Each entry above was written on its date, before the outcome. A journal you can prune is not a journal.