Market Movers: Crude Oil Up 5.2%, Gold Down 3.9%, and $3.3 Trillion Erased as Iran Reshapes Everything
Market Moves | Thursday 11 June 2026 | Post-Close read
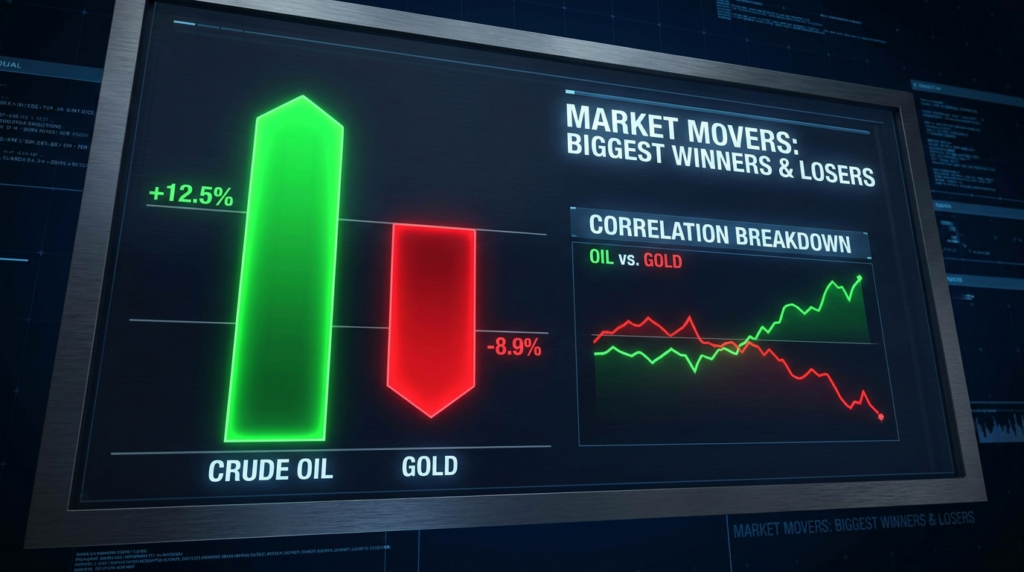
Today was a five-standard-deviation day. Crude oil surged 5.2% to $92.79. Gold crashed 3.89% to $4,094. VIX spiked 11.83% above 22. The S&P 500 has now erased $3.3 trillion in market capitalisation since the June 2nd high. Oracle beat earnings after hours and rallied 10%. Every major asset class moved with conviction. Not one of these moves can be understood in isolation. Each one explains the others, and together they tell the story of a market in regime change.
THESIS
The magnitude of today’s cross-asset moves signals a regime change, not a normal risk-off day. Traditional correlations have broken down. Gold fell while crude surged during a war. Bitcoin held while equities crashed. Energy outperformed while every other sector bled. These contradictions are not random. They follow a specific logic: the Iran crisis is repricing supply chains, inflation expectations, and margin mechanics simultaneously. Understanding what each move tells us about market structure is the edge.
The Movers at a Glance
| Asset | Close | Change | What It Tells Us |
|---|---|---|---|
| Crude Oil (WTI) | $92.79 | +5.20% | Supply shock is real; market believes Hormuz closure persists |
| Gold | $4,094 | -3.89% | Margin liquidation overwhelming safe-haven demand |
| VIX | 22.22 | +11.83% | Fear regime confirmed; crossed above 20 threshold |
| S&P 500 | 7,257 | -$3.3T from high | Below 7,300 for first time since Iran escalation began |
| Oracle (ORCL) | ~$185 AH | +8-10% AH | Cloud/AI demand resilient; micro vs macro test at open |
| Bitcoin (BTC) | $61,483 | -0.26% | Remarkably stable; decoupling or lagging? |
| DXY (Dollar) | 104.50 | Elevated | Safe-haven bid + inflation premium = dollar demand |
| Natural Gas | $3.28 | +3.14% | LNG supply disruption from Hormuz closure |
Move 1: Crude Oil +5.2% — The Supply Shock
The biggest mover and the most important price in the world right now.
Iran’s full shutdown of the Strait of Hormuz is the most significant oil supply disruption in decades. Not since the 1990 Gulf War has a chokepoint of this magnitude been physically closed. The commodity deep dive detailed how Shell’s CEO quantified the damage at 1.2 billion barrels “in the hole” and why Saudi spare capacity cannot close the gap.
What the price move tells us about market structure: the 5.2% surge was not panic buying. It was systematic repricing of supply risk. Energy-focused funds bought throughout the session. The futures curve shifted into steep contango, confirming the market expects disruption to persist.
What it means for everything else: crude at $92.79 is not just an oil story. It feeds directly into the macro picture through inflation pass-through. CPI at 4.2% was printed before this crude surge has time to reach consumers. The macro analysis flagged this channel as the primary risk to the broader market outlook. Every other asset class prices off this one move.
Move 2: Gold -3.89% — The Margin Mechanics
Gold falling during a war is the headline contradiction of the session.
The answer is not complicated. It is margin mechanics. The commodity deep dive explained the cascade in detail: equity losses trigger margin calls, institutions liquidate liquid assets with unrealised gains, gold ETFs are extremely liquid. Gold gets sold not because anyone wants to sell gold, but because they need cash for equity margin calls.
What the price move tells us about market structure: the selling was concentrated in large institutional blocks, not retail panic. That tells us this is forced selling, not fear selling. Forced selling exhausts itself. Fear selling can persist. This distinction matters for the dip-buy thesis.
| Gold Selling Analysis | Evidence | Implication |
|---|---|---|
| Selling type | Large institutional blocks, not retail | Forced selling, not conviction selling |
| Fundamental backdrop | War, inflation 4.2%, central bank buying | All bullish for gold; crash is purely mechanical |
| Historical pattern | Every margin crash recovered within weeks | Dip-buy opportunity once selling exhausts |
| Silver confirmation | Silver also down -2.61% | Precious metals correlation confirms margin, not fundamental |
What it means for everything else: gold’s crash is a warning sign for every leveraged asset. If margin calls are hitting gold, they can hit anything liquid. The digital flow analysis noted that crypto may face the same dynamic with a 24-48 hour lag. The tactical playbook incorporated this timing risk into the dip-buy setup.
Move 3: VIX +11.83% — The Fear Threshold
VIX crossing above 20 is a regime marker. Below 20, markets are in complacency mode. Above 20, risk management changes.
At 22.22, we are in a fear regime. The volatility analysis detailed how negative gamma across all 10 tracked options symbols means dealers must sell into declines, amplifying downside moves. A whale who loaded OTM VIX calls before the Iran headlines is now up 56%.
What the VIX move tells us about market structure: the 11.83% spike in a single session means options markets are repricing tail risk aggressively. Protection is expensive. The put/call ratio at 1.071 confirms bearish skew. Institutions are not just hedging — they are positioning for further downside.
| VIX Level | Regime | Position Sizing Impact |
|---|---|---|
| Below 15 | Complacency | Full sizing available |
| 15-20 | Caution | Standard sizing with wider stops |
| 20-25 (current: 22.22) | Fear | REDUCED sizing mandatory |
| 25-30 | Panic | Minimum sizing or flat |
| Above 30 | Crisis | Capital preservation only |
Move 4: S&P 500 Below 7,300 — The $3.3 Trillion Drain
The S&P 500 fell below 7,300 for the first time since the Iran escalation began. Total market capitalisation loss since the June 2nd high is now $3.3 trillion.
That is not a correction. That is capital destruction.
The institutional derisking analysis showed leveraged speculators net short -482,975 S&P contracts. The options analysis showed max pain at SPY 709. The sentiment analysis has fear and greed at 27.5. Bank of America’s indicator now has 70% of bear market signals triggered.
| Equity Damage Assessment | Value | What It Tells Us |
|---|---|---|
| Market cap lost since Jun 2 | $3.3 trillion | Scale of loss triggers institutional margin calls |
| SPX level | 7,257 | Below 7,300 for first time since crisis began |
| BofA bear signals | 70% triggered | Institutional risk models flashing warning |
| Leveraged ETF volume | $90 billion record | Extreme hedging and speculative repositioning |
| SPY max pain target | 709 | Options positioning pulling prices lower |
The global grid analysis showed how this equity damage extends beyond the US. Energy-importing nations face acute pressure. European indices are caught between energy costs and proximity to the conflict. Asian markets are expected to gap lower on Thursday’s open.
Move 5: Oracle +8-10% AH — The Micro Exception
Oracle’s after-hours surge after beating earnings is the one positive data point in a sea of red. The earnings analysis detailed the cloud revenue beat and the AI infrastructure demand picture.
What this move tells us about market structure: earnings still matter at the stock level. Cloud and AI demand is not disappearing because of Iran. Companies with genuine revenue growth can still attract buyers even during crisis conditions.
But. And this is the critical qualification. The earnings analysis also noted $159 billion in tech sector debt issuance in 2026, rising energy costs for data centres, and the historical pattern of macro overwhelming micro during crises. Oracle’s beat is real. Its ability to lift the sector on Thursday is uncertain.
Move 6: Bitcoin -0.26% — The Anomaly
Bitcoin barely moved while everything else exploded. The digital flow analysis explored two competing explanations: genuine decoupling from risk assets (bullish for the digital gold narrative) or a 24-48 hour lag before margin contagion hits (bearish for the immediate price path).
What this move tells us about market structure: crypto’s institutional infrastructure may have matured to the point where BTC no longer acts as leveraged beta to equities during the first wave of a shock. Whether it holds through the second wave — the margin call cascade — is Thursday’s test.
The Correlation Breakdown
In normal markets, the following relationships hold: gold rises when equities fall. Gold and crude move together during geopolitical risk. Crypto moves with tech. Energy and equity indices correlate positively.
Today, none of these held.
| Traditional Correlation | Expected | Actual | Why |
|---|---|---|---|
| Gold vs Equities | Gold up, equities down | Both down | Margin liquidation overrides safe-haven |
| Gold vs Crude | Both up in war | Crude up, gold down | Different mechanisms: supply shock vs margin call |
| Crypto vs Tech | Move together | Tech down, crypto flat | Decoupling or lag — unresolved |
| Energy vs Equity | Move together | Energy up, equity down | Producers benefit; consumers suffer |
This correlation breakdown is the single most important structural signal of the day. It means standard portfolio construction fails. Diversification does not diversify. Risk models built on historical correlations are wrong. The only way to navigate this environment is to understand the specific mechanism behind each move and position accordingly. The dark pool positioning analysis showed institutions had already begun this recalibration: $90 billion in leveraged ETF volume represents not just hedging but a fundamental rethinking of portfolio construction under regime change conditions. The institutional flow data revealed the three-way divergence between asset managers (+982K long), leveraged funds (-482K short), and dealers (-626K short) that makes traditional correlation-based risk management meaningless.
That is what the entire daily sequence has done today. From the institutional derisking data through the macro shock, through the sentiment regime, the volatility explosion, the sector rotation, the options mechanics, the currency repricing, the commodity analysis, the tactical setups, the conviction ranking, and the earnings context. Each perspective adds a piece. Together, they explain why every traditional correlation broke today and what to do about it.
Sizing and Risk
| Parameter | Our Read |
|---|---|
| Overall Risk | Around 72% — the magnitude of cross-asset moves signals a regime change event; traditional risk management frameworks are insufficient |
| Sizing Tier | REDUCED across all asset classes — no exceptions until VIX returns below 20 |
| Correlation Regime | Broken — standard diversification is not working; position each asset on its own merits |
| Key Variable | Iran — single headline can reverse every major mover simultaneously |
Scenarios for Thursday
| Scenario | Probability | What Happens to the Movers |
|---|---|---|
| Bull Case | 15% | Iran ceasefire reverses all major moves simultaneously. Crude collapses below $82. Gold recovers above $4,250. Equities bounce sharply on short squeeze. VIX drops below 20. Oracle gap holds. The most violent relief rally in months. |
| Sideways | 25% | Markets digest the shock. Crude stabilises near $90. Gold finds a floor at $4,050. Equities chop in a range. VIX holds 20-24. Oracle gap-up partially fades. The market absorbs the Iran headlines without further acceleration. |
| Correction | 60% | Escalation continues. Crude above $95. Gold falls further on additional margin calls. S&P tests 7,100. VIX pushes toward 28. Oracle AH gains fade at the open. Every major mover extends in its current direction. Bitcoin finally joins the selloff. |
What Each Move Tells Us About Tomorrow
Crude above $90 means inflation is not going away. That means rate cuts are not coming. That means equity valuations face sustained pressure from higher discount rates. That is the transmission mechanism from Move 1 to Move 4.
Gold’s crash means margin calls are active. That means institutional portfolios are under stress. That means more forced selling is possible across any liquid asset. That is the transmission mechanism from Move 2 to Move 6.
VIX above 22 means every position needs wider stops and smaller size. The volatility regime dictates risk management, and the current regime says: be small.
The conviction ranking identified crude long, gold dip-buy, and equity short as the top three opportunities. The tactical playbook provided specific entries, stops, and targets. The earnings analysis tempered expectations for Oracle. And this analysis ties them all together into a coherent picture of a market in regime change.
The tension that cuts across every mover is this: the sentiment reading at Fear and Greed 27.5 is approaching the contrarian buy zone, yet the fundamental catalyst driving the fear has no financial resolution. In every prior instance where F&G dropped below 25, the catalyst was financial: tariffs, earnings misses, policy errors. Those catalysts can be reversed with a policy pivot, a data surprise, or a negotiated outcome. The Hormuz closure is physical. Oil cannot flow through a closed strait regardless of what the Fed does or what earnings reports say. The macro pulse documented CPI at 4.2% before this crude surge hits consumer prices. The basis analysis found $3+ contango to December, the market pricing months of disruption. The currency assessment identified 105K yen short contracts as systemic risk. The options architecture confirmed universal negative gamma. Every piece of data says the correlation breakdown is structural, not transient. And yet, the AAII bears at 37% and the $2 million November SPY call buyer from the options analysis remind us that someone always bets on resolution. The discipline is in sizing for the possibility they are right while positioning for the probability they are not.
Tomorrow is not a normal Thursday. It is the next chapter of the first major geopolitical supply shock since the 1990s. We are sized for it.
Continue Reading
Previously in the sequence:
▶ Dark pool positioning turns defensive — $90B leveraged ETF volume, institutional derisking
▶ CPI hits 4.2% as Iran war premium reprices rates — inflation locks out rate cuts
▶ Fear and Greed drops to 27.5 — AAII bearish 37%, approaching contrarian zone
▶ VIX surges to 22.22 on negative gamma — VVIX 108, negative GEX universal
▶ S&P 500 breaks below 7,300 — key technical levels collapsing
▶ Energy and defence surge as tech rotates — only positive sector, rotation to defence
▶ Global markets tumble on Hormuz closure — Nikkei most exposed, FTSE outperforming
▶ Asset managers hold 982K long vs 482K short — dealer derisking divergence
▶ Negative gamma across all 10 options symbols — max pain SPY $709, VIX calls +56%
▶ Sector rotation into energy and defence — energy surge, tech distribution
▶ Futures basis widens on crude contango — Treasury paradox, equity discount
▶ Dollar strengthens as yen surges — 105K yen short squeeze, DXY dual tailwind
▶ Bitcoin holds $61,483 despite risk-off — resilience vs gold crash
▶ Crude surges while gold crashes — Hormuz premium, margin liquidation
▶ Three war-premium setups with defined risk — crude long, gold watch, equity short
▶ Conviction ranking: crude and gold lead — ranked opportunity hierarchy
▶ Oracle beats earnings while everything burns — micro vs macro collision
Analysis, not financial advice. Always manage your own risk. Published by Alpha Insights, 11 June 2026.
Deepen Your Understanding
Related articles from the Titan Protect Foundry: