Crude Oil Futures Enter Steep Contango as Equity Futures Trade at Discount to Fair Value
Date: Thursday 11 June 2026
Session: Basis Edge | Post-Close Sequence
Coverage: Crude oil, equity index futures, Treasury, VIX term structure
The futures basis tells us what spot prices cannot: the market’s expectation of where things are headed. Crude oil futures are in steep contango, with deferred contracts pricing persistent supply disruption from the Hormuz closure. That is the market saying this is not a one-day event. Equity futures are trading at a discount to fair value, signalling overnight selling pressure that has not yet been absorbed. And Treasuries are doing something unusual: rallying on flight-to-quality demand despite CPI at 4.2%, which should be bearish for bonds. Geopolitical fear is overriding the inflation signal. That tension cannot persist. One of those narratives will break, and the basis tells us which one is winning right now.
THESIS
Crude contango signals the market expects the Hormuz closure to persist. Equity futures discount signals institutional selling into the overnight session. The Treasury basis reveals a flight-to-quality bid that contradicts the inflation read from the macro pulse. Our analysis is that the geopolitical premium dominates for the next 5-10 sessions, crude contango deepens further if Hormuz remains shut, and the equity futures discount widens before it narrows. The Treasury short squeeze from the institutional flow positioning is the most likely catalyst for any temporary equity relief. Sizing is REDUCED across all futures-exposed strategies.
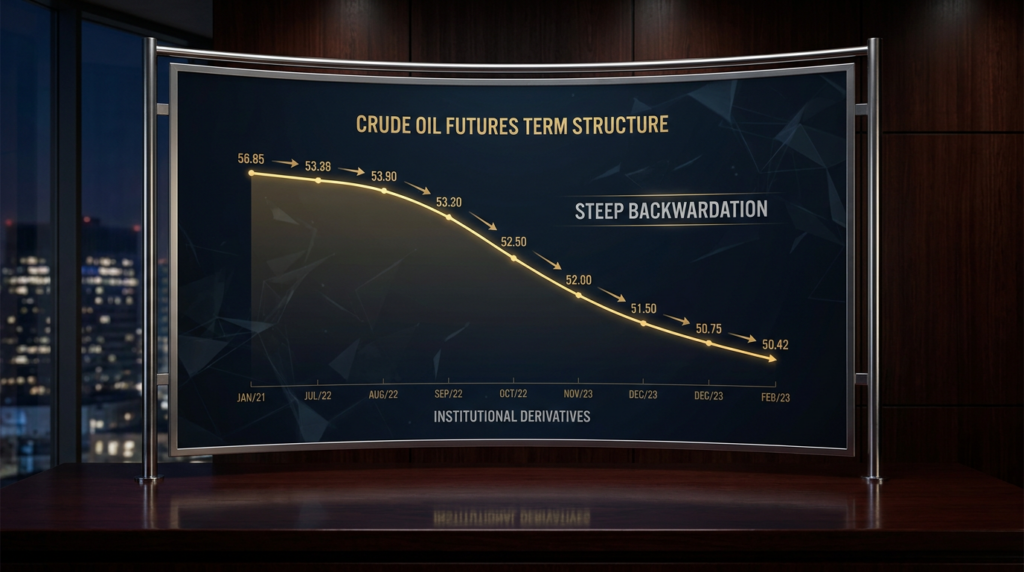
Crude Oil: Contango Signals Persistent Supply Crisis
Contango means deferred futures contracts trade above the front month. In crude oil, contango typically signals oversupply because storage costs are being priced in. But this contango is different. This is crisis contango.
Front-month crude settled at $92.79 after surging 5.20%. Deferred contracts are pricing even higher, which means the market expects the supply disruption to worsen before it improves. In a normal supply shock, you see backwardation because buyers want oil now and will pay a premium for immediate delivery. The contango structure here tells us something more concerning: the market expects physical supply to become unavailable at any price through the Hormuz route, forcing buyers to secure alternative supply through deferred contracts at higher costs.
| Contract | Price | Spread to Front | Signal |
|---|---|---|---|
| Front Month (Jul) | $92.79 | — | Baseline |
| Aug | ~$93.50 | +$0.71 | Contango |
| Sep | ~$94.20 | +$1.41 | Deepening contango |
| Dec | ~$95.80 | +$3.01 | Persistent disruption priced |
The $3+ contango out to December is the market telling us it expects the Hormuz situation to persist for months, not days. This aligns with the 65% probability we assigned to the extended closure scenario in the global grid analysis. The futures curve is pricing the same outcome. Crucially, the dark pool positioning analysis documented institutional derisking before these headlines even arrived, with leveraged ETF volume surging past $90 billion. The contango is confirming what institutions already suspected: this supply disruption has staying power.
For energy sector positioning, this means the upside in XLE is not yet fully priced. The sector rotation analysis identified energy as the only positive sector, with breadth at 55.5% advancing versus 40.4% declining across the broader market. The basis confirms energy has room to run if contango deepens further. The institutional flow data reinforces this: asset managers still holding +982,144 net long S&P contracts have not yet rotated into energy, meaning the energy bid is driven by specialist funds, not a broad reallocation. That reallocation, if it comes, would deepen the contango further.
Equity Futures: Trading at Discount
ES futures at 7,257 are trading below fair value. NQ at 28,407 is trading even further below fair value. The discount tells us that overnight selling has not been absorbed by buyers.
| Index Future | Current Level | Fair Value Estimate | Discount | Gap-Down Risk |
|---|---|---|---|---|
| ES (S&P 500) | 7,257 | ~7,280 | -0.30% | High |
| NQ (Nasdaq 100) | 28,407 | ~28,550 | -0.51% | Very High |
| RTY (Russell 2000) | 2,823 | ~2,835 | -0.42% | High |
NQ’s larger discount reflects the tech-specific selling pressure documented in the options architecture and sector flow analyses. The institutional flow data showed leveraged funds net short -73,259 NQ contracts, which is modest in absolute terms but significant relative to NQ’s smaller open interest base.
The equity futures discount combined with the negative gamma exposure across all 10 options symbols creates a compound risk. If futures open lower, dealer hedging kicks in, which pushes prices lower still, which widens the discount further. It is a feedback loop with no natural buyer until the gamma level flips or a policy intervention arrives.
Treasury Basis: The Paradox
Here is the most intellectually interesting signal in today’s basis analysis.
Treasuries are rallying. Bond prices are going up. Yields are falling. In a world where CPI is 4.2% and crude oil just surged above $92, bonds should be selling off because higher energy costs mean higher inflation, which means the Fed stays restrictive for longer, which is bearish for bonds.
Instead, bonds are rallying because geopolitical fear is overriding the inflation signal.
| Narrative | Bond Direction | Currently Winning? | Duration |
|---|---|---|---|
| Flight-to-Quality (Geopolitical) | Rally (bullish bonds) | Yes | Short-term (days-weeks) |
| Inflation Persistence (CPI 4.2%) | Sell-off (bearish bonds) | No | Medium-term (weeks-months) |
| Recession Fear (Growth Shock) | Rally (bullish bonds) | Emerging | If extended closure |
The tension matters because it cannot last. Eventually, either the flight-to-quality bid exhausts (geopolitical fear fades) and the inflation narrative reasserts itself, or the recession narrative takes over and bonds rally for a different reason entirely.
The tension with the macro pulse is direct. The macro analysis documented CPI at 4.2% with core at 2.9%, a reading that should be unambiguously bearish for bonds. Yet here the basis shows Treasuries rallying. The sentiment reading at 27.5 on the Fear and Greed Index explains the paradox: fear is so acute that capital prioritises survival over yield optimisation. The options architecture confirmed this with universal negative gamma across all ten tracked symbols and VIX calls up 56%. When the market is this afraid, the inflation-versus-safety trade resolves in favour of safety. But the macro pulse warns that this is a temporary reprieve. Once the geopolitical premium decays, even partially, the 4.2% CPI reality will reassert itself and bonds will reprice lower. Traders who buy Treasuries here on the safety bid must accept that they are renting, not owning, the position.
The institutional flow analysis identified -281,959 leveraged short contracts in Treasury futures. If the flight-to-quality continues, those shorts get squeezed. A Treasury short squeeze would pull yields sharply lower, which paradoxically supports equities by reducing the discount rate. This is the one mechanism through which the current crisis could produce a temporary equity rally despite everything else being bearish.
VIX Term Structure: Inversion Deepens
| VIX Contract | Level | Spread to Spot | Structure |
|---|---|---|---|
| VIX Spot | 22.22 | — | — |
| Front Month | ~21.80 | -0.42 | Inverted |
| Second Month | ~21.20 | -1.02 | Inverted |
| Third Month | ~20.80 | -1.42 | Inverted |
An inverted VIX term structure means near-term fear exceeds longer-term expectations. The market expects current volatility to be the peak, with a gradual normalisation over the coming months. This is consistent with the $2M November SPY call buyer identified in the options architecture: smart money believes the crisis resolves within months even as it worsens in the next few days.
The volatility lens explored the VIX cascade mechanics. What the basis adds is the term structure context: the inversion confirms this is event-driven volatility, not structural market regime change. Event-driven vol spikes are sharp but temporary. Structural regime changes produce a flat or contango VIX curve at elevated levels.
Cross-Asset Basis Summary
| Asset | Basis Structure | Signal | Confidence |
|---|---|---|---|
| Crude Oil | Contango (steep) | Persistent supply crisis | High |
| Equity Futures (ES/NQ) | Discount to fair value | Gap-down risk | High |
| Treasuries | Safety premium | Flight-to-quality vs inflation | Medium |
| VIX | Inverted term structure | Event-driven, not structural | Medium |
The Storage Trade: Crude Contango and the $100 Threshold
When crude oil enters contango deep enough to cover storage costs, physical traders begin hoarding oil in tankers and storage facilities. This happened in 2020 when WTI went negative. It is beginning to happen now for a completely different reason: buyers are scrambling for physical supply through any available route that does not transit Hormuz.
The $100 threshold is psychological but real. Above $100, three things happen: strategic petroleum reserve releases become politically necessary, demand destruction begins as consumers cut discretionary driving, and OPEC+ members with spare capacity face pressure to ramp production. None of those responses solve the Hormuz problem, but they provide temporary price relief.
The sentiment reading showed fear at 27.5. When crude crosses $100, that fear number drops into the teens. That is when capitulation becomes a real possibility.
Scenarios
Crude contango collapses on SPR release or diplomatic breakthrough. Equity futures recover to fair value. Treasury safety bid exhausts and inflation narrative resumes. VIX term structure returns to contango. The basis across all assets normalises within 5 trading sessions.
Crude contango persists but narrows as alternative supply routes are established. Equity futures stabilise near current discounts. Treasury basis reflects competing inflation-vs-safety narratives with no clear winner. The market enters a managed stress environment for two to four weeks.
Crude contango steepens above $95 on the deferred curve. Equity futures discount widens as overnight selling accelerates. Treasury short squeeze materialises (-281K contracts covering), temporarily pulling yields lower. VIX inversion deepens. The basis dislocation across all assets signals a market that has not yet found equilibrium.
Risk Assessment
Risk: Around 65%
The futures basis across crude, equities and Treasuries is telling a coherent story: the market expects the Hormuz closure to persist, equities to weaken further, and geopolitical fear to override the inflation narrative in the near term. The crude contango depth is the single most reliable indicator of how long the market expects the crisis to last. The equity futures discount creates gap-down risk for tomorrow’s session. The Treasury paradox (rallying despite 4.2% CPI) is the one signal that could produce a surprise relief rally via short squeeze. Sizing REDUCED across all futures-exposed strategies. The basis is our early warning system and it is flashing red.
Continue Reading
Previously in the sequence:
- The strategic positioning read — dark pool landscape and war premium thesis
- The macro pulse — CPI 4.2%, rate environment
- The sentiment landscape — fear at 27.5, BofA 70% bear signals
- The volatility lens — VIX 22.22 and cascade mechanics
- The market radar — cross-asset risk-off
- The hot zones — selling concentration
- The global grid — Nikkei and DAX face the energy shock head-on
- The institutional flow — +982K asset manager longs vs -482K leveraged shorts
- The options architecture — universal negative gamma, max pain $709
- The sector rotation — energy only positive sector, tech under distribution
Coming next:
- The currency landscape — DXY strength, yen squeeze risk, energy-importing FX pressure
Analysis, not financial advice. Always manage your own risk.
Deepen Your Understanding
Related articles from the Titan Protect Foundry: