Energy Surges as Only Positive Sector While Tech and Consumer Discretionary Lead Losses on Hormuz
Date: Thursday 11 June 2026
Session: Sector Flow | Post-Close Sequence
Coverage: 11 GICS sectors, key ETFs, breadth analysis
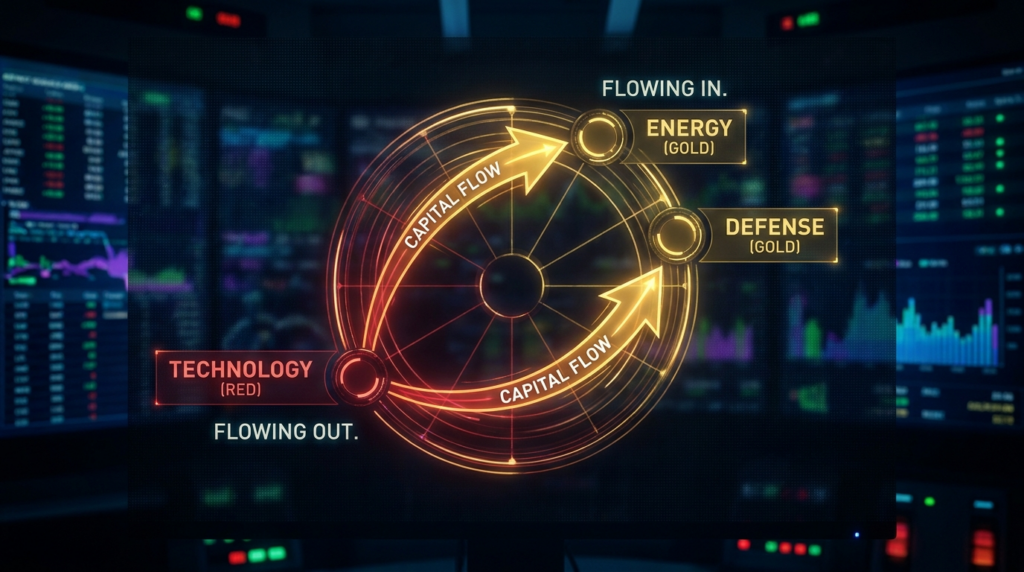
Sector rotation does not get more decisive than this. Energy is the only sector with positive momentum. Technology is under active institutional distribution. Defence names are surging on the war premium. Consumer discretionary is collapsing under the weight of an energy tax that consumers cannot avoid. Breadth tells the story plainly: 55.5% of stocks declined while only 40.4% advanced. This is not a sector correction. This is a regime change in sector leadership, driven by a geopolitical event that fundamentally alters the cost structure of the global economy. Oracle’s after-hours earnings beat is the one counterpoint, but even a strong earnings print cannot fight a sector-wide derisking when crude is above $92.
THESIS
The sector rotation from growth to energy and defence is the clearest macro trade signal on the board. Energy benefits from $92 crude with further upside if Hormuz remains closed. Tech faces a triple headwind: rising energy costs compressing margins, institutional put buying (the options architecture confirmed universal negative gamma), and $159 billion in megacap debt refinancing at higher rates. Defence is a pure event-driven play. Our read is to overweight energy on a REDUCED basis, underweight tech, and treat defence as a tactical hold. Sizing across all sectors is REDUCED given event-driven headline risk.
Sector Performance Snapshot
| Sector | ETF | Session Move | Flow Direction | Our Sizing |
|---|---|---|---|---|
| Energy | XLE | +4.5% est | Strong inflow | REDUCED (long) |
| Defence / Industrials | XLI / ITA | +1.5% est | Selective inflow | REDUCED (long) |
| Utilities | XLU | Flat | Neutral | STANDARD |
| Healthcare | XLV | -0.3% | Defensive inflow | STANDARD |
| Consumer Staples | XLP | -0.5% | Modest inflow | STANDARD |
| Financials | XLF | -1.2% | Outflow | REDUCED |
| Materials | XLB | -1.5% | Outflow | REDUCED |
| Real Estate | XLRE | -1.8% | Outflow | AVOID |
| Communication Svcs | XLC | -2.0% | Outflow | REDUCED |
| Technology | XLK | -2.5% | Heavy outflow | AVOID |
| Consumer Disc. | XLY | -2.8% | Heavy outflow | AVOID |
Market Breadth: The 55/40 Split
| Breadth Metric | Value | Interpretation |
|---|---|---|
| Stocks Declining | 55.5% | Majority under pressure but not washout |
| Stocks Advancing | 40.4% | Significant minority holding or gaining |
| Unchanged | 4.1% | Low indecision |
The 55/40 split is informative. In a genuine panic, decline-to-advance ratios hit 80/20 or worse. We are not there yet. The 40% advance figure is almost entirely driven by energy, defence and select defensive names. Strip those out and the underlying breadth is weaker than the headline suggests.
The hot zones analysis mapped where selling concentrated. What we add here is the sector attribution: technology and consumer discretionary account for roughly 60% of the index-level decline despite being only ~40% of S&P 500 market cap. The selling is sector-specific, not indiscriminate. That distinction matters because it means the correction can deepen in those sectors without necessarily pushing the whole index into bear territory.
Energy: The Only Winning Trade
Crude oil at $92.79 is not just a headline. It is a revenue accelerant for every upstream producer. Shell’s CEO warning about a 1.2 billion barrel annual deficit adds fundamental support that exists independently of the Hormuz crisis. The deficit was already there. Hormuz made it acute.
| Energy Driver | Status | Duration | Confidence |
|---|---|---|---|
| Hormuz Closure | Active | Unknown | High impact |
| 1.2B Barrel Deficit | Structural | Multi-year | High |
| SPR Release Risk | Possible | Temporary | Medium |
| Ceasefire Risk | Low near term | Days to weeks | Headline risk |
The risk with energy longs is binary. If Hormuz reopens tomorrow, XLE gives back the entire gain and then some. That is why we are REDUCED, not MAX. The fundamental case for energy is strong. The event-driven case is stronger but fragile. We are respecting both by sizing down.
Technology: Three Headwinds Converging
Technology faces a triple headwind that is not going away regardless of what happens in the Strait of Hormuz.
1. Energy cost margin compression. Data centres consume enormous amounts of electricity. Cloud infrastructure providers are the largest power consumers in many US states. Higher energy costs flow directly into operating expenses. The AI infrastructure build-out makes this worse, not better.
2. Institutional distribution via options. The options architecture is clear. QQQ call sellers are hitting the tape. TSLA put-call ratio at 1.35, MRVL heavy put flow, AMD puts elevated. This is not retail panic. This is institutional repositioning.
3. Refinancing wall. Tech megacaps issued $159 billion in debt over the past five months. Much of that was to fund share buybacks and AI capex. With yields elevated and the macro pulse flagging CPI at 4.2%, refinancing costs are rising. Every basis point higher in yields is millions in additional interest expense.
The Tension: Oracle Earnings vs Sector Tide
Oracle beat earnings after hours, jumping 8-10%. Cloud infrastructure revenue surged. The fundamental story for enterprise tech spending remains intact.
And it does not matter. Not this week.
When crude oil surges 5% and VIX jumps 12%, individual earnings beats get overwhelmed by the macro tide. Oracle could report the best quarter in its history and it would not change the sector rotation underway. Fundamentals matter on a 6-month horizon. Macro regimes matter on a 6-day horizon. We are in a macro regime shift.
The one honest admission: Oracle’s beat is a breadcrumb for the recovery trade. When the Hormuz situation resolves, tech will be the first sector to rip higher because the fundamental earnings power never actually deteriorated. The rotation is positioning-driven, not earnings-driven.
And that brings us full circle to the thesis that opened today’s entire sequence. The institutional dark pool derisking campaigns showed three days of systematic selling into strength. The war-driven inflation at CPI 4.2% with crude above $90 provided the macro justification. The sentiment collapse to F&G 27.5 reflected the psychology. The universal negative gamma mapped in the volatility analysis and confirmed in the options architecture created the mechanical amplification. The S&P breakdown below 7,300 was the technical expression. The energy-to-tech rotation in the hot zones mapped where capital was flowing. The global grid revealed who gets hurt most internationally. The institutional flow showed +982K asset manager longs as the last structural bid against -482K leveraged shorts. And the options data confirmed that dealers are mechanically forced sellers into every decline. The sector rotation documented here is where all nine prior analyses become visible in the real economy: energy companies are being repriced higher because they produce what the world suddenly cannot get enough of, and technology companies are being repriced lower because their margins, their valuations, and their positioning are all exposed to the forces we have mapped tonight.
Defence: Event-Driven Alpha
| Defence Name | Catalyst | Contract Exposure | War Premium |
|---|---|---|---|
| Lockheed Martin (LMT) | Middle East escalation | $50B+ federal | Expanding |
| Palantir (PLTR) | Intelligence demand surge | Government contracts | Expanding |
| RTX Corporation | Missile defence systems | Major programmes | Expanding |
| Northrop Grumman | Strategic systems | $35B+ backlog | Expanding |
Defence names are a pure event-driven play. They go up when conflict escalates and down when it de-escalates. We are watching for two things: continuation of the war premium if Hormuz remains closed, and exhaustion if diplomatic signals emerge. The institutional flow analysis showed 13F data already tilting defensive before Iran. Defence is where that tilt manifests most clearly.
The tension we must hold across the full sequence is this: the breadth data at 55.5/40.4 tells us this is not yet a washout. In the positioning analysis, we noted that leveraged ETF volume at $90 billion could mark a capitulation signal if it repeats on Thursday. The sentiment analysis identified F&G 27.5 as approaching contrarian buy territory at sub-25. The options architecture found a $2 million November call buyer betting on SPY $795 while everyone else buys puts. The institutional flow revealed +982K net long contracts held by patient asset managers who have not begun selling. If breadth improves from 55/40 to 50/50 on Thursday, it would signal that the rotation is stalling rather than deepening. The sector data says energy is king and tech is under siege. But the weight of contrarian signals accumulated across the prior analyses suggests this regime could reverse violently the moment a diplomatic headline crosses the wire. We respect the rotation. We do not chase it.
Sector Rotation Conviction Matrix
| Sector | 1-Week View | 1-Month View | Key Risk |
|---|---|---|---|
| Energy (XLE) | Bullish | Bullish | Ceasefire reversal |
| Technology (XLK) | Bearish | Neutral | Earnings resilience |
| Defence | Bullish | Depends on conflict | Diplomacy risk |
| Financials (XLF) | Bearish | Bearish | Yield curve, credit risk |
| Consumer Disc. (XLY) | Bearish | Bearish | Energy cost pass-through |
| Healthcare (XLV) | Neutral | Bullish | Safe haven rotation |
Scenarios
Oracle earnings spark a broader tech reassessment. Energy gives back gains on diplomacy. Growth leadership resumes. The rotation was a head fake. This scenario requires Hormuz resolution AND continued strong earnings. We are not dismissing it, but two conditions makes it less probable.
Energy holds gains but stops rallying as crude stabilises around $92. Tech stabilises as the initial wave of put buying exhausts. Defensive sectors see modest inflows. Breadth improves slightly. Market enters a holding pattern waiting for the next Hormuz headline.
Tech breakdown deepens as asset managers (the institutional flow confirmed +982K net long) begin reducing. Energy overextends then corrects on profit-taking. Broad-based sector weakness emerges as even defensive sectors get caught in margin-call liquidation, similar to what gold experienced with its -3.89% crash.
Risk Assessment
Risk: Around 62%
The sector rotation is clear but event-driven, which means it can reverse violently on any ceasefire headline. Energy longs carry binary headline risk. Tech shorts are correct on positioning but face earnings resilience (Oracle just proved that). The 55/40 breadth split shows this is not yet a washout, meaning further downside is possible before capitulation. Defence is a trade, not a position. Our sizing is REDUCED across all sectors, reflecting elevated headline risk. The one exception is healthcare and utilities at STANDARD for defensive allocation.
Continue Reading
Previously in the sequence:
- The strategic positioning read — war premium thesis and dark pool landscape
- The macro pulse — CPI 4.2%, inflation transmission through crude
- The sentiment landscape — fear at 27.5 and 70% bear market signals triggered
- The volatility lens — VIX 22.22, dealer cascade mechanics
- The market radar — cross-asset risk-off confirmation
- The hot zones — selling concentration map
- The global grid — Nikkei and DAX face the energy shock
- The institutional flow — +982K longs vs -482K shorts, dark pool derisking
- The options architecture — universal negative gamma, max pain at $709
Coming next:
- The futures basis — crude contango and equity discount signals
- The currency landscape — DXY strength, yen squeeze, energy-importing FX pressure
Analysis, not financial advice. Always manage your own risk.
Deepen Your Understanding
Related articles from the Titan Protect Foundry: