Market breadth: is it the whole market or just my chart?
Look at any chart and say, in plain words, whether its last finished day moved with the whole market or against it, and why that matters.
By the end of this lesson you will be able to look at any chart and say, in plain words, whether its last finished day moved with the whole market or against it, and why that matters. You will also be able to read your own chart's count of what followed those days, and say why "No clear lean" is an honest answer.
1. One chart can mislead you
Foundry lesson. Free, no gate. Page: /foundry/market-breadth/. Educational interpretation only. Not financial advice.
How to use this lesson at your level
- Beginner: sections 1 to 5 and the traps in section 16. Get the habit of asking "whole market or just my chart?" first.
- Intermediate: add sections 6 to 9. Finished days, flat moves, a fair board, and what a day against the board is.
- Advanced: sections 10 to 12. Titan's offline research, reading your chart's own count, and broad days.
- Expert: sections 13 to 15, plus the honest limit in every section. The skill is knowing what a count of the past cannot tell you.
Say a stock fell 1.5% today. Was something wrong with that stock? Maybe. But if almost every other market fell too, the stock simply moved with everything else. The same 1.5% means something quite different when most markets rose and this one fell.
So before reading anything into a move, ask one question: is it the whole market, or just my chart?
Honest limit: knowing that a move was shared, or not shared, describes the day. It does not explain why it happened or what comes next.
2. What breadth means
Breadth is how many markets took part in a move. A rise is broad when most markets rose with it. It is narrow when a few rose and the rest did not. An index can rise on a narrow day, because a few very large stocks can carry it while most others slip.
The classic breadth tool for a whole exchange is the advance-decline line, which adds up rising minus falling stocks every day. A board does the same job on a smaller scale: it lists a set of markets and counts how many rose and how many fell.
Honest limit: a board of a few dozen markets is a sample, not the whole market. A different board can give a different count on the same day.
3. Counting a board fairly
A fair count needs three choices made in advance:
- Which markets count. Index futures, broad funds, sector funds and large stocks all describe the stock market, so they belong in the count.
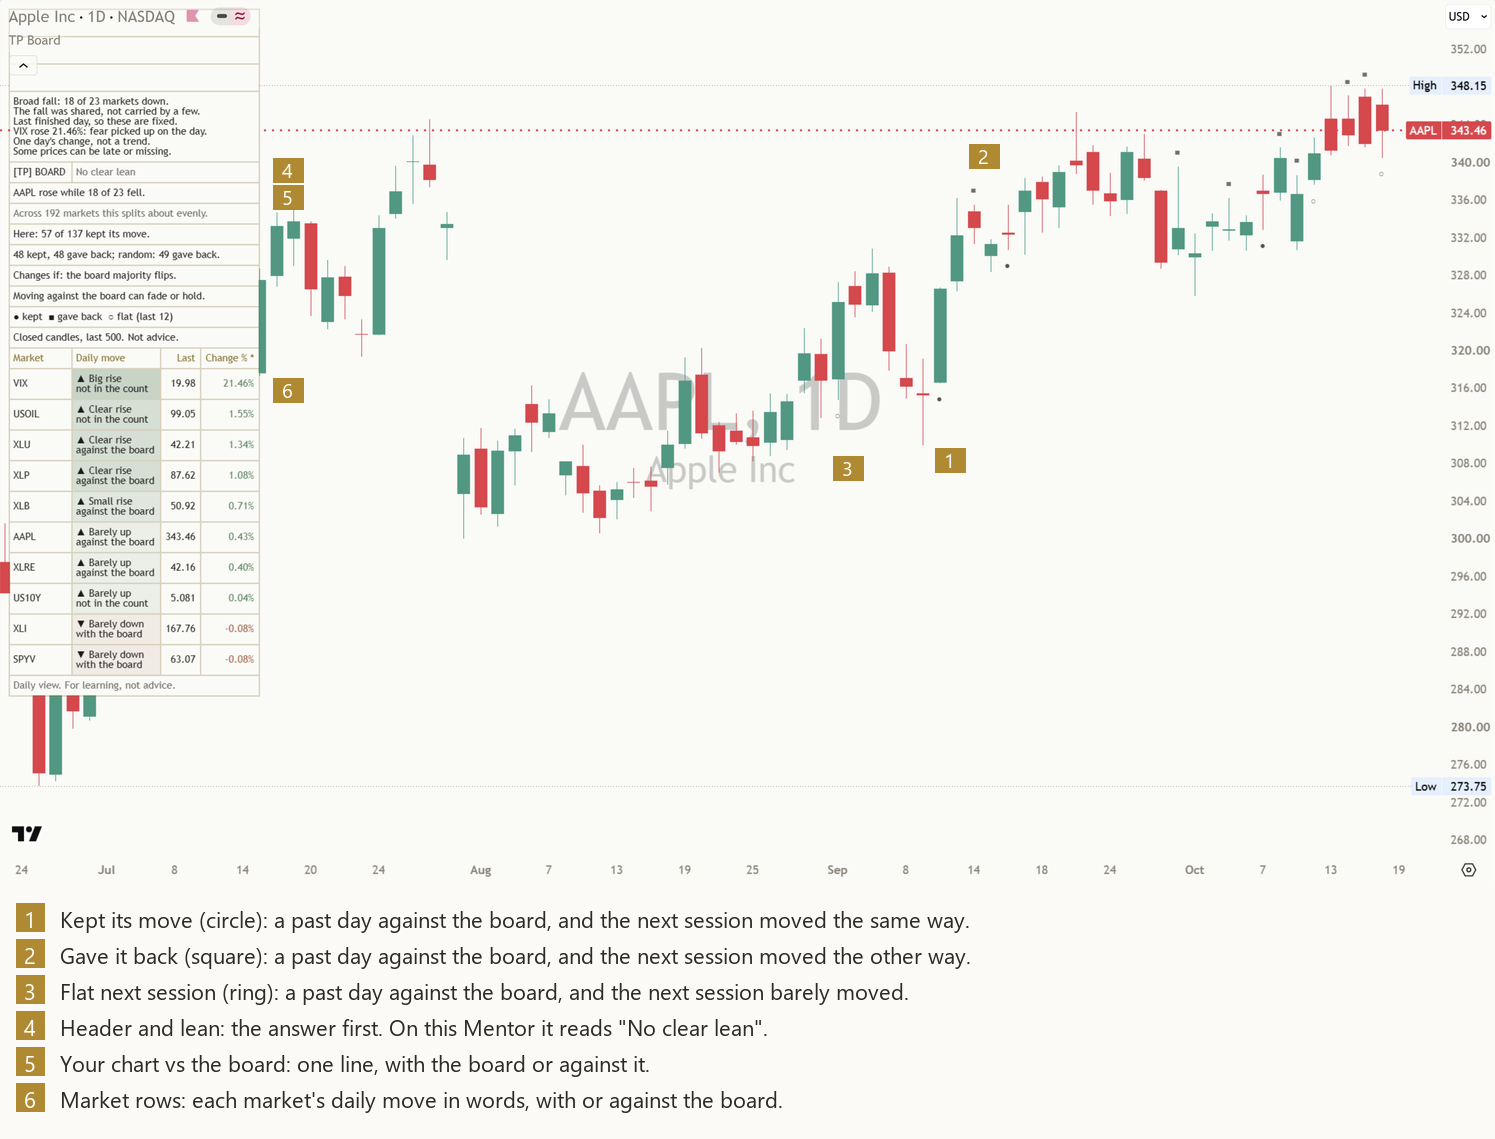
- What counts as up or down. A tiny move is noise. The Market Board Mentor treats any move within 0.10% either way as flat, for the board and for your chart.
- How big the board must be. With only a handful of prices, a majority means little. The Mentor needs at least 10 counted markets with a price before it compares.
Honest limit: these are choices. Move the flat band or change the list and some days read differently. Neither reading is the true one.
4. Why some markets sit outside the count
VIX, the dollar, the 10-year yield, gold, silver, oil and bitcoin are worth watching on the same screen, but they often move against stocks for their own reasons. VIX in particular tends to rise when stocks fall. Mixing them into the count would blur the stock market's majority, so the board shows them with the note "not in the count". See the VIX lesson and the Dollar Index lesson for what each one measures.
Honest limit: leaving them out keeps the count clean. It does not mean they do not matter on a given day.
5. With the board or against it
Once the board has a majority, your chart either moved the same way or the other way:
- With the board: your chart rose and most markets rose, or both fell.
- Against the board: your chart rose while most markets fell, or fell while most rose.
- Split board: as many markets rose as fell. There is no majority, so no with or against.
Every read works the same way in both directions. A rise against a falling board is the mirror of a fall against a rising board.
Honest limit: a mirrored rule treats both directions fairly. It does not mean both directions are equally likely on a given chart.
6. The finished-day rule
A daily candle that is still open can turn around before the close, and so can the board. A board read halfway through the day can show 18 markets falling at noon and 9 by the close. So the honest habit is to compare finished days only: your chart's last finished daily candle beside each market's last finished daily candle.
There is one more wrinkle. Markets finish their days at different times. Stocks close at one hour, VIX a little later, futures later again. A fair board moves each market to the new day only after its own daily close.
Honest limit: waiting for the finished day costs time. That delay is the price of a read that does not change after you see it.
7. Flat days
Some days your chart barely moves. A day within 0.10% of the day before is flat: not with the board and not against it. Flat days are not counted as against the board, because there was no real move to compare.
Honest limit: 0.10% is a choice. A wider band would call more days flat.
8. What the board says, row by row
On the Market Board Mentor each row gives the market's daily move in words, in four sizes each way, so colour is never the only clue: "▲ Big rise" for 2.5% or more, then "▲ Clear rise", "▲ Small rise" and "▲ Barely up", and the same four for falls. Under the move, each row says "with the board", "against the board", "board is split" or "not in the count".
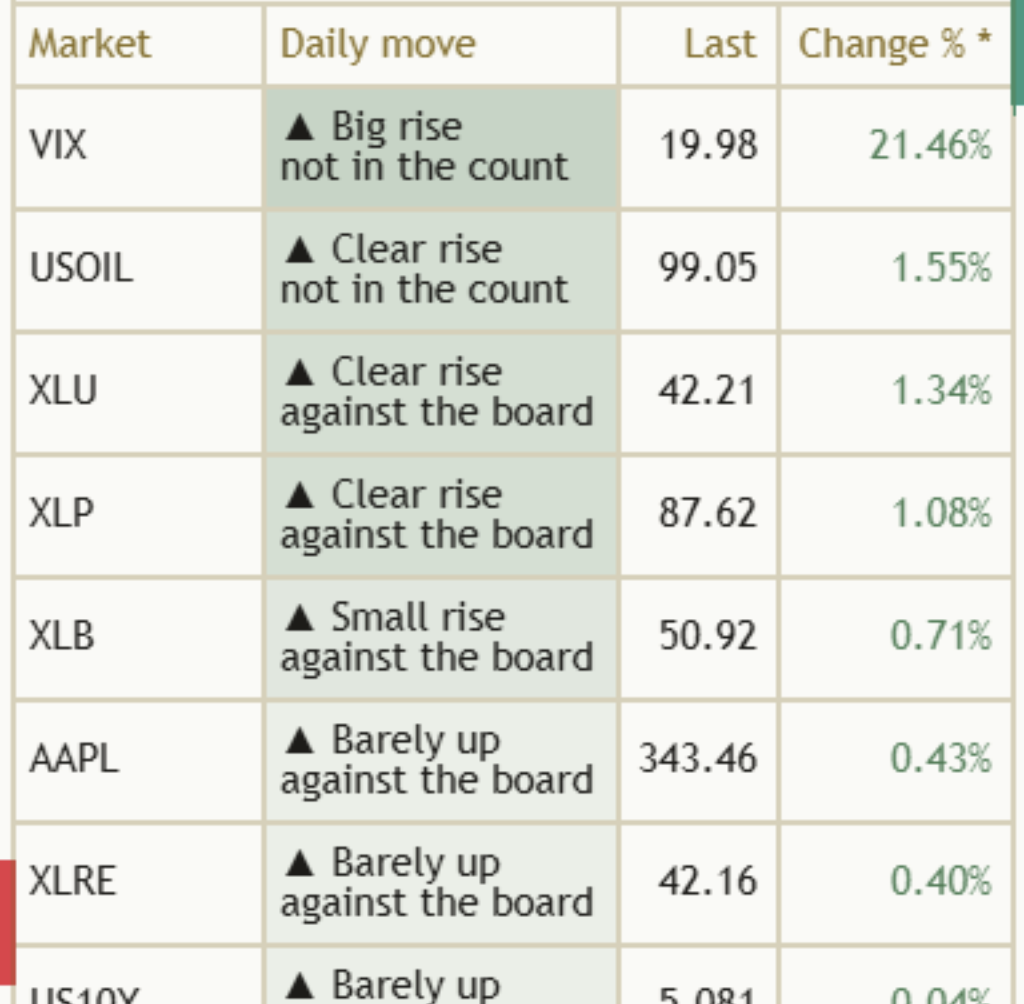
Honest limit: the rows show one day. A single row against the board says nothing about why.
9. Days against the board, and what followed
A day against the board is worth remembering, so it is worth counting what happened next. Watch the next finished session after each one, and sort it into one of three outcomes:
- Kept its move: the next session moved the same way again.
- Gave it back: the next session moved the other way.
- Flat: the next session closed within 0.10% of the day before.
Only count a day once its next session has finished. That keeps every count final.
Honest limit: one next session is a short window. A longer window would sort the same days differently.
10. Titan research: testing the count offline
We tested this rule on 192 markets offline. This is our research, not something the indicator reads on your chart.
A day against the board feels like it is telling you something. To find out whether it does, we counted a lot of them and compared them with ordinary days. We took 192 liquid stocks, daily from January 2020 to October 2026, and found every finished day where one of them moved against this same board: 59,676 days. The next session:
- kept the move on 28,468 of them,
- gave it back on 28,528,
- and 2,680 were flat.
Per 100 days: 48 kept, 48 gave back, 4 flat. Then ordinary days on the same stocks, the ones that moved with the board: they gave back 49 times in 100. So a day against the board gave back 48 times in 100, and an ordinary day 49. The gap is 1 in 100. That is nothing.
We also checked broad days, when at least 65% of the board moved together. After a broad fall, SPY rose the next session 51 times in 100, the same as any day. After a broad rise, the result changed between 2020 to 2023 and 2023 to 2026, so it was not steady either.
None of this is on the panel. It is one reason the Mentor's header always reads "No clear lean": it does not call a direction.
Honest limit: this is history, from stocks on today's list. Markets that no longer trade are missing, and the older years rest on fewer names.
11. Your chart's own count, and why one chart is too few
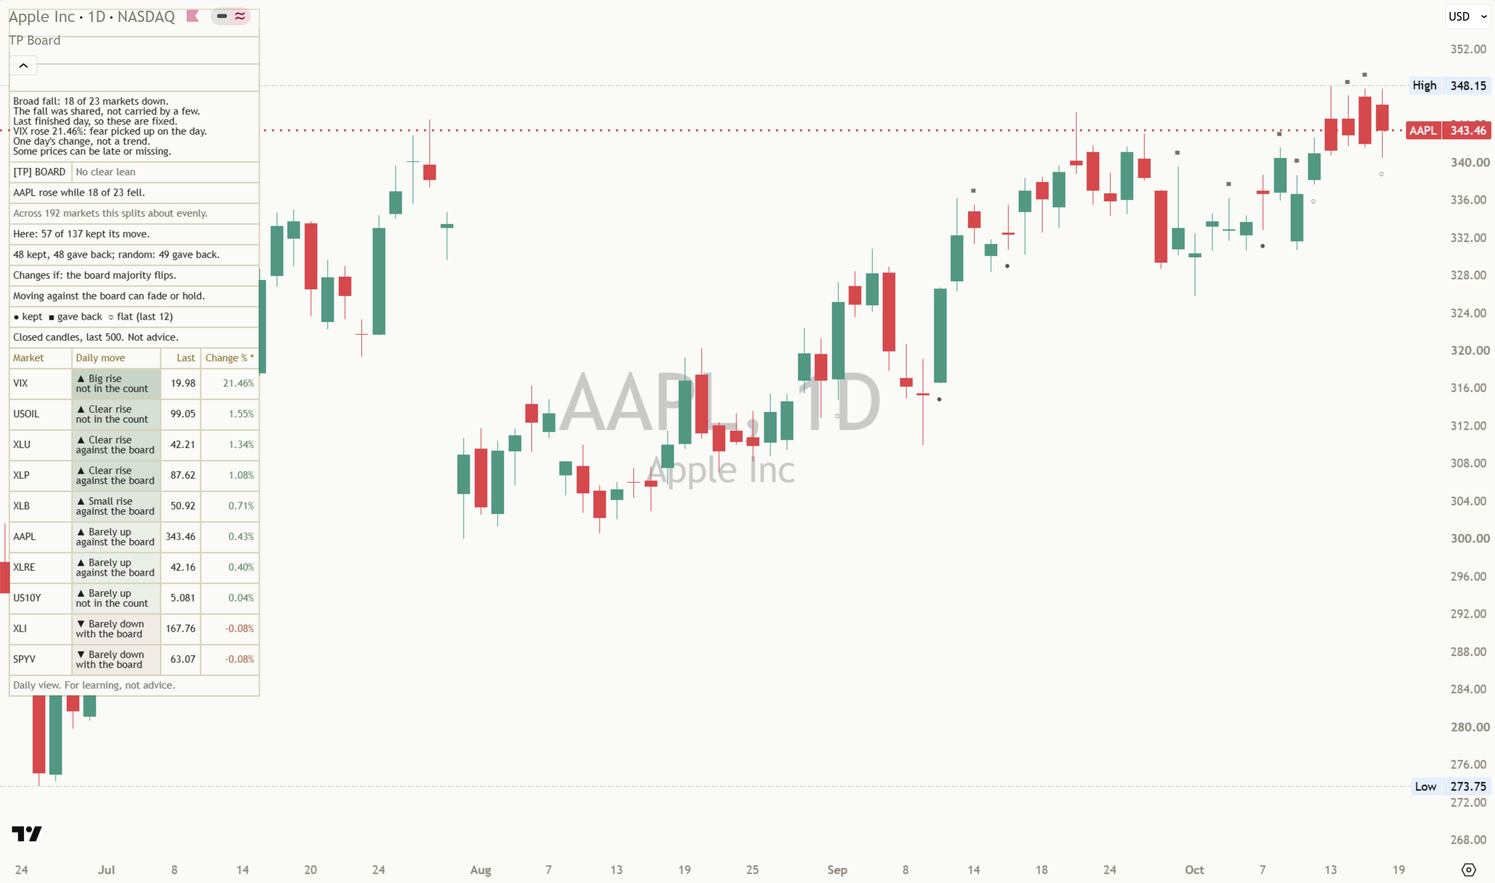
The panel counts your own chart: its past days against the board in the last 500 finished days, and how many kept their move. On AAPL daily after the Friday 16 October close it read "Here: 57 of 137 kept its move." On NAS100 daily it read "Here: 37 of 74 kept its move."
A single chart has a few dozen days like that, sometimes a hundred or so. That is too few to tell a habit from chance, so "Here" never sets the header. Under 8 days the panel says "Too few here to count yet (n)." with the number so far. Use "Here" to check the marks by eye, not as a forecast.
Honest limit: a one-sided "Here" count on one chart is exactly what chance produces now and then. Every number on the panel comes from your chart, so read it as history on that chart, not as a habit.
12. Broad days
Some days nearly the whole board moves one way. The board summary above the panel says so in words, for example "Broad fall: 18 of 23 markets down." (AAPL daily, 16 Oct).
It is not shown as a lean. A broad day is worth knowing about, because it tells you a move was shared. It does not tell you what the next session does.
Honest limit: one broad day is still one day. A different board could call the same day differently.
13. Why the counts are history, not promises
A count of past outcomes feels like a probability. It is not quite one:
- Small samples. A few dozen days on one chart is not many. A few lucky ones can tilt it.
- One board. Another market list gives different days against it and different counts.
- Markets change. 2020 to 2026 may have been calmer or wilder than what comes next.
- The window rolls. As old days drop out of the last 500, "Here" can shift with nothing new on the chart.
That is why "Here" never sets the header, and why the header does not call a direction.
Honest limit: counts are the most honest summary of the past we can give. They are still only the past.
14. What changing the board does
- The market list: add or remove markets and the majority changes on some days, so different days count as against the board.
- Finished candles off: the rows show today while it is still forming. That is useful to watch, but it can change with every tick. The Mentor's counts still wait for finished days.
- The timeframe: the board is daily on every timeframe. On an intraday chart the panel only sees the days the chart has loaded, so its counts can be smaller.
Honest limit: editing the list until an old chart looks clean makes it look better on that chart only.
15. Honest limits, all in one place
- One day is one day: a day against the board can fade or hold.
- A sample: a board is a few dozen markets, not the whole market.
- Finished days: the open candle can change until the close.
- Split boards: a real answer when there is no majority.
- Counts: history from one chart, not a promise.
- Small samples: one chart's "Here" count never sets the header.
- Choices: the flat band, the list and the minimum board size all shape the read.
- Neither direction is favoured: every read works the same way up and down.
16. Six common traps
- Reading one chart alone. Ask whole market or just my chart.
- Reading the open candle. Wait for the finished day.
- Counting VIX or the dollar with stocks. Keep context markets out of the count.
- Treating a day against the board as a promise. It can fade or hold.
- Reading a count without asking what it rests on. Check how many days are behind it.
- Trusting one chart's few days. "Here" is for checking by eye, and under 8 days there is nothing to count.
17. Practise it
- Pick one market and keep it for a few weeks.
- At the end of each day, before you look at any panel, say out loud: did most markets rise or fall, and did my chart go with them?
- When your chart goes against the board, note it and check the next session. Kept, gave back, or flat?
- Keep a one-line log per day against the board, including the ones that did not go the way you expected.
- After a dozen days, count them yourself before you look at any panel.
Key takeaways
What to remember
- Breadth asks how many markets took part in a move. One chart alone can mislead you.
- Count a board fairly: the right members, a flat band, and a minimum size.
- Compare finished days only. Each market finishes its day on its own clock.
- A day against the board can keep its move, give it back, or be flat the next session.
- The panel counts past days against the board on your chart only: "Here: n of m kept its move."
- The header says "No clear lean": the Mentor does not call a direction.
- The counts are history from this board, not promises.
18. See it explained live: [TP] Market Board - Mentor
Everything in this lesson is built into [TP] Market Board - Mentor, a free indicator on TradingView. It puts a 30-market board on your price chart and talks you through it in plain English, so you can practise on live markets instead of from memory.
Here is where each part of the lesson shows up:
- The board (sections 2 to 4). Thirty markets come with it. Twenty-three count: the index futures ES1!, NQ1!, YM1! and RTY1!, the funds IWM, SPYV, SPYG and SMH, seven sector funds, and eight large stocks. VIX, DXY, US10Y, GOLD, SILVER, USOIL and BTCUSD are shown with "not in the count". "Use the usual market list" switches to your own two lists.
- With or against (section 5). The line under the header puts your chart beside the board, for example "AAPL rose while 18 of 23 fell." or "AAPL rose with 18 of 23." (worked examples). A split board reads like "AAPL flat; board split: 12 up, 12 down." and a thin board says "Board too small to compare today."
- Finished days (section 6). "Use finished daily candles" is on by default. Before the first finished day the line says "Waiting for a finished board day."
- Days against the board (section 9). "Mark past events" (on by default) puts a filled circle where the move was kept, a square where it was given back, and a hollow ring where the next session was flat. The circle and ring sit under the day's low and the square over its high. The last 12 stay on the chart, in one solid neutral colour. "Show still-open event" adds one ring at the latest day against the board until its next session finishes: "Still open, not counted yet".
- The count (section 11). The header reads "[TP] BOARD" and "No clear lean". Then your chart's own count, for example "Here: 57 of 137 kept its move." Under 8 days on your chart it says "Too few here to count yet (n)."
- The change condition. With "Mentor detail" on Full (the default), one row says what would change the read: "Changes if: the board majority flips."
- One day is one day (section 15). One of three limit lines closes every panel: "Moving against the board can fade or hold.", "Against the board can fade or hold." or "One finished day is still one day."
- On the chart at the top of this lesson, AAPL daily after the Friday 16 October close, the panel read "AAPL rose while 18 of 23 fell." then "Here: 57 of 137 kept its move."
- How to read the panel, top to bottom. The board summary, the header, your chart beside the board, "Here", the change condition, one limit line, the legend "● kept ■ gave back ○ flat (last 12)", and the footer: "Closed candles, last 500. Not advice." It never prints a percentage and never instructs.
- Easier to read. "Board colours" on Auto matches your chart. "Columns to show" on Phone keeps three columns and six rows. "Text size" goes from Tiny to Large.
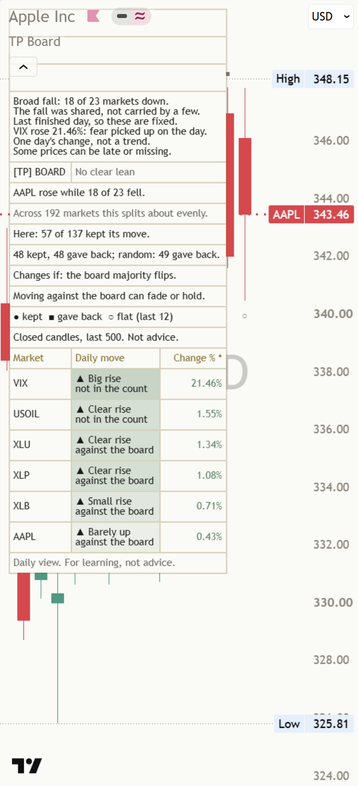
A good way to use it: say what you see first: did the board rise or fall, and did your chart go with it or against it? Then read the marks: did past days against the board keep their move, give it back, or go flat? Then check the panel's count and how many days it rests on. Where you disagree is where you learn.
Test yourself
Take the 17-question quiz below to check what stuck.
Question 1 of 17 · Beginner
Your stock fell 1.5% today. What is the first question the Market Board helps you answer?
Question 2 of 17 · Beginner
What does market breadth describe?
Question 3 of 17 · Beginner
The panel reads "AAPL fell with 18 of 23." What does that tell you?
Question 4 of 17 · Beginner
The panel reads "AAPL rose while 18 of 23 fell." What kind of day was it for AAPL?
Question 5 of 17 · Beginner
Why are VIX, gold and the dollar shown with "not in the count"?
Question 6 of 17 · Intermediate
What does the finished-day rule mean?
Question 7 of 17 · Intermediate
Stocks, VIX and futures finish their days at different times. How does a fair board handle that?
Question 8 of 17 · Intermediate
Your chart closed 0.05% higher than the day before. How does the Mentor treat that day?
Question 9 of 17 · Intermediate
On one day 12 counted markets rose and 12 fell. What does the board say?
Question 10 of 17 · Intermediate
When is a past day against the board counted and marked?
Question 11 of 17 · Intermediate
Your chart fell against a rising board, and the next session it rose. Which mark does that day get?
Question 12 of 17 · Advanced
AAPL daily shows "AAPL rose while 18 of 23 fell." What does that line tell you?
Question 13 of 17 · Advanced
Your chart's panel shows "Here: 9 of 17 kept its move." Why does that count not set the header?
Question 14 of 17 · Advanced
A chart has 5 past days against the board in its last 500 finished days. What does the "Here" line say?
Question 15 of 17 · Expert
Where do the numbers on the Market Board Mentor panel come from?
Question 16 of 17 · Expert
You edit the market list and an old chart's "Here" count suddenly looks one-sided. What is the honest view?
Question 17 of 17 · Expert
The header reads "[TP] BOARD | No clear lean". What does that mean?
Educational interpretation only. Not financial advice. The board describes days that already finished, and the counts are history, not promises about what comes next.
Learn the idea here. Apply it with the desk.
Titan Protect turns lessons like this into a daily practice: live market research, the full framework, and the tools that put it to work. This lesson is free; the desk is where it compounds.