Fear and greed on a chart: what the extremes actually did
Look at any chart and say, in plain words, how stretched its latest fall or rise is, whether that stretch is rare for this chart, and what happened in the ten candles after past extremes.
By the end of this lesson you will be able to look at any chart and say, in plain words, how stretched its latest fall or rise is, whether that stretch is rare for this chart, and what happened in the ten candles after past extremes. You will also be able to read this chart's own count of past extremes, both ways, and say why a small count cannot tell a habit from chance.
1. Two kinds of "sentiment"
Foundry lesson. Free, no gate. Page: /foundry/fear-and-greed-on-a-chart/. Educational interpretation only. Not financial advice.
How to use this lesson at your level
- Beginner: sections 1 to 4 and the traps in section 15. Get the habit of seeing fear and greed as the size of a move on this chart.
- Intermediate: add sections 5 to 8. Rare for this chart, one event per burst, three outcomes judged on closes.
- Advanced: sections 9 to 11. Counting what followed past extremes on your own chart, both ways, and reading the newest extreme candle's high and low as a live lean.
- Expert: sections 12 to 14, plus the honest limit in every section. The skill is knowing when a count adds nothing.
When people say sentiment they usually mean a mood score for the whole market, such as the Fear and Greed Index, built from several US market inputs and shown the same on every chart. See The Fear and Greed Index for that one.
This lesson is about a different, narrower reading: fear and greed measured from one chart's own candles. It cannot tell you what people feel. It can tell you how hard this chart has just fallen or risen, compared with its own past.
Honest limit: a candle reading is not a survey. Calling it "fear" is a name for a fast fall, not proof of anyone's mood.
2. The fear reading
Take the highest close of the last 22 candles. Measure how far the current candle's low sits below it, as a share of that close. A quiet chart gives a small number. A fast fall gives a large one. This is the idea behind the well-known Williams Vix Fix: a stress reading made from price alone.
Honest limit: the reading grows with any fast fall, for any reason. It does not know why price fell.
3. The greed reading
Greed is the mirror. Take the lowest close of the last 22 candles and measure how far the current candle's high sits above it. A fast rise gives a large number.
Honest limit: a large greed reading says a rise was fast. It does not say the rise is too far or about to end.
4. Rare for this chart
A fear reading of 4 means very different things on a calm currency and on a fast coin. So each reading is ranked against its own last 100 readings. In the top tenth it is called extreme. In the top third it is called high. Otherwise it is normal.
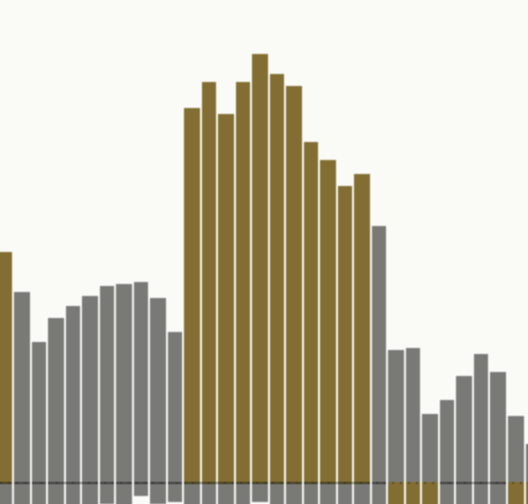
Honest limit: "rare" is relative to the last 100 candles. After a long calm spell, a modest move can rank as extreme.
5. One event per burst
Extreme readings come in bursts: a fast fall often keeps the reading high for several candles. Counting each of those candles would count the same move many times. So an extreme only counts when the reading first enters its top tenth after at least 5 candles outside it, more than 10 candles after the last counted extreme, and while no earlier extreme is still being watched.
Honest limit: these spacing rules are choices. Looser rules give more events, but many of them would be the same move.
6. Three outcomes over ten candles
From the extreme candle, watch the next ten finished candles. The first close beyond either end of the extreme candle decides:
- Cleared its high: a candle closed above the extreme candle's high first.
- Broke its low: a candle closed below the extreme candle's low first.
- Neither: no close beyond either end within ten candles.
The same three outcomes apply after fear and after greed, so the two are mirrors. Only closes decide. A long wick decides nothing.
Honest limit: ten candles is a choice. A longer window would sort the same extremes differently.
7. Why "neither" is common
Extreme candles are wide. The wider the candle, the further price has to travel to close beyond either end. So after an extreme, "neither" is more common than after an ordinary candle. The panel counts these cases on your chart, so you can see how often it happens there.
Honest limit: this is a fact about candle size. It says nothing about which way price goes next.
8. The idea everyone repeats
The most popular fear gauges promise that extreme fear "finds bottoms". It is an appealing story: when everyone is scared, the low must be near. But a story is not a count. The only way to check it is to count what happened after past extremes, with the other outcomes beside it.
Honest limit: a story you like is the one to check hardest.
9. Count it on your own chart
The only fair way to check a story about extremes is to count what followed them on the chart in front of you. Take every fresh extreme on one side, fear or greed, in the last 500 candles, and sort each one into its outcome: cleared its high, broke its low, or neither. That is the whole count. Nothing is carried in from other markets.
Honest limit: one chart has only a handful of extremes in 500 candles. The count shows what happened here, not what must happen next.
10. Both outcomes, and the neither cases
A single number hides the other outcomes. "7 broke their low" sounds strong until you see that 5 cleared their high and 2 did neither. So always read the outcomes together: how many went each way, and how many went nowhere. If the two directions are close, the extremes on this chart told you little about direction.
| What you count (worked example) | What it means |
|---|---|
| 5 cleared, 7 broke low, 2 neither | Close: the fear extremes here went both ways |
| 2 cleared, 11 broke low, 1 neither | Lopsided, but still only 14 extremes |
| 3 cleared, 3 broke low, 8 neither | Mostly wide candles that went nowhere |
Honest limit: even a lopsided count from 14 extremes can come from chance. A couple of new extremes can swing it a long way.
11. The extreme candle's high and low
A dozen or so extremes is too few to tell a habit from chance, so the count never sets a lean. What can be read live is the newest extreme candle itself. Its high and low are two lines on your chart, and each close after it sits above, below or between them.
- Above its high after fear: a sharp fall, then a close above the extreme candle's high. Traders call this a washout that reversed: the fall was rejected. The Mentor says "Fear washout reversed: above its high." and the header reads "Leans up".
- Below its low after fear: "Fear kept going: below its low." The fall carried on. "Leans down".
- Above its high after greed: "Greed kept going: above its high." The rise carried on. "Leans up".
- Below its low after greed: a spike that reversed: "Greed spike reversed: below its low." "Leans down".
- Between them: "Inside the extreme candle: undecided." The header reads "No clear lean".
The panel shows the candle's levels, for example "Fear extreme 6 candles ago: high 2412.50, low 2398.10." (worked example), and what would change the read: on an up lean "Changes if: two closes inside in a row, or a clear close below 2398.10." The first close past the high or low sets the lean straight away. After that a lean ends only on two closes back inside in a row (after one, the panel says "Held: one more close inside 2398.10 to 2412.50 ends the lean."), and a new lean needs a clear close past the edge, at least half an average candle range ("Clear close past the edge"), or two closes past it in a row. The lean lasts 50 candles after the extreme ("Read the extreme candle for"), then reads "No clear lean" until the next one.
Honest limit: a lean says where the last close sits, not where price goes next. Two closes inside, or one clear close past the other edge, can change it, which is why the panel always names the price that would.
12. This chart's own count
The panel shows this chart's own counts, from the extremes on the side it reads in its last 500 candles, with both outcomes together: for example "Here: 5 cleared, 7 broke low." and then "2 of 14 were neither." (worked example; the neither line is left out when none went neither way). Under 8 extremes it says "Too few here to count yet (5)." (worked example). Every number on the panel comes from the chart it sits on.
Honest limit: 14 extremes is very few. A couple of them can swing the count a long way.
13. Two tools, one move
A fast fall pushes the fear reading to an extreme. It also pushes RSI towards oversold. When the two agree, it is tempting to count two reasons. It is one move, seen twice. See Reading RSI for how RSI is built.
Honest limit: agreement between tools that read the same candles is not independent evidence.
14. Honest limits, all in one place
- This chart only: the reading comes from its candles, not from people.
- A name, not a mood: "fear" means a fast fall, "greed" a fast rise.
- Rare is relative: ranked against the last 100 readings.
- Closes decide: a wick decides nothing.
- Neither is common: extreme candles are wide.
- Both ways: read every outcome, never one alone.
- Count, not lean: one chart's count is too small to set a lean.
- A lean is a place: it reads the last close against one candle, not the future.
- Counts: history, not a promise.
15. Six common traps
- Reading extreme fear as a low. Count it on your chart before you believe it.
- Mixing a chart reading with a market survey. They measure different things.
- Calling every tall column extreme. Extreme means rare for this chart.
- Counting every candle in a burst. One move, one event.
- Reading one outcome alone. Ask how many went the other way and how many did neither.
- Counting agreeing tools as separate reasons. One move, seen twice.
16. Practise it
- Pick one market and one timeframe and keep them for a few weeks.
- When a column turns gold, say out loud: fear or greed, and how fast was the move?
- Write down what you expect in the next ten candles, then watch them. Cleared its high, broke its low, or neither?
- Keep a one-line log per extreme, including the ones that did not go the way you expected.
- After a dozen extremes, count them yourself, both ways, and compare with the panel's count.
- After each extreme, write down its high and low. Each close, note whether price is above, below or between them, and compare with the header.
Key takeaways
What to remember
- Fear and greed here are the size of a recent fall or rise on this chart, ranked against its own past.
- An extreme counts once per burst and is judged on closes over ten candles.
- After extremes, "neither" is common, because extreme candles are wide.
- Read this chart's count both ways, with the neither cases kept in.
- The count never sets the lean: one chart has too few extremes to tell a habit from chance.
- The lean is live: the last close against the newest extreme candle's high and low, named as a play, with the price that would change it.
- The counts are history, not promises.
17. See it explained live: [TP] Sentiment - Mentor
Everything in this lesson is built into [TP] Sentiment - Mentor, a free indicator on TradingView. It draws the fear and greed readings in a pane under your price chart and talks you through them in plain English, so you can practise on live markets instead of from memory.
Here is where each part of the lesson shows up:
- The readings (sections 2 and 3). Fear columns rise above the dotted zero line and greed columns reach below it. "Candles in the reading" sets the 22 and "Reading to show" picks Fear, Greed or Both.
- Rare for this chart (section 4). A column turns gold in its top tenth of the last 100 readings. "Extreme level" offers Top fifth, Top tenth and Top twentieth. The panel names the state, for example "Fear is extreme: top tenth of 100." or "Greed is high, not extreme."
- The outcomes (sections 6 and 7). Once ten candles are done, "Mark past events" puts a circle (cleared its high), a square (broke its low) or a ring (neither) on the extreme candle on the price chart: at its low after fear, at its high after greed. The last 12 stay on the chart, the older half of them drawn fainter, and "Mark size" sets how big they are.
- The extreme candle (section 11). The header reads "Leans up", "Leans down" or "No clear lean" from the last close against the newest extreme candle. Under the state, the panel names the play (for example "Fear washout reversed: above its high."), the candle's high and low, and "Changes if" with the price that would change the read. With "Play alerts with prices" on, an alert carries those prices.
- The counts (sections 9, 10 and 12). Then this chart's counts with both outcomes and the "were neither" line. Every number comes from the chart it sits on.
- On the chart at the top of this lesson, gold (XAUUSD) one hour, read on 22 Oct 2026, the panel was reading a fear extreme 46 candles back: "Fear and greed are both normal.", "Inside the extreme candle: undecided.", "Fear extreme 46 candles ago: high 4131.485, low 4115.575." and "Changes if: a clear close above 4131.485 or below 4115.575, or two in a row.", then "Here: 4 cleared, 3 broke low." and "1 of 8 were neither."
- The teaching line. One line changes with each new extreme, such as "High fear marks a fast fall, not a floor." or "Fear and oversold can arrive together." The footer: "Closed candles, last 500. Not advice." While the header leans it reads "A named play is a pattern, not a promise." It never prints a percentage and never instructs.
- A second timeframe, if you want it. "Show higher-timeframe context" (off by default) adds one row in the Full panel from the last finished candle on the next higher timeframe, for example "Agrees: higher timeframe same extreme." or "Neutral: higher timeframe is normal." It reads one candle, not a history.
- Easier to read. "Colours" on Auto matches your chart. "Panel text size" goes from Tiny to Large, and Standard keeps the panel to nine rows at most.
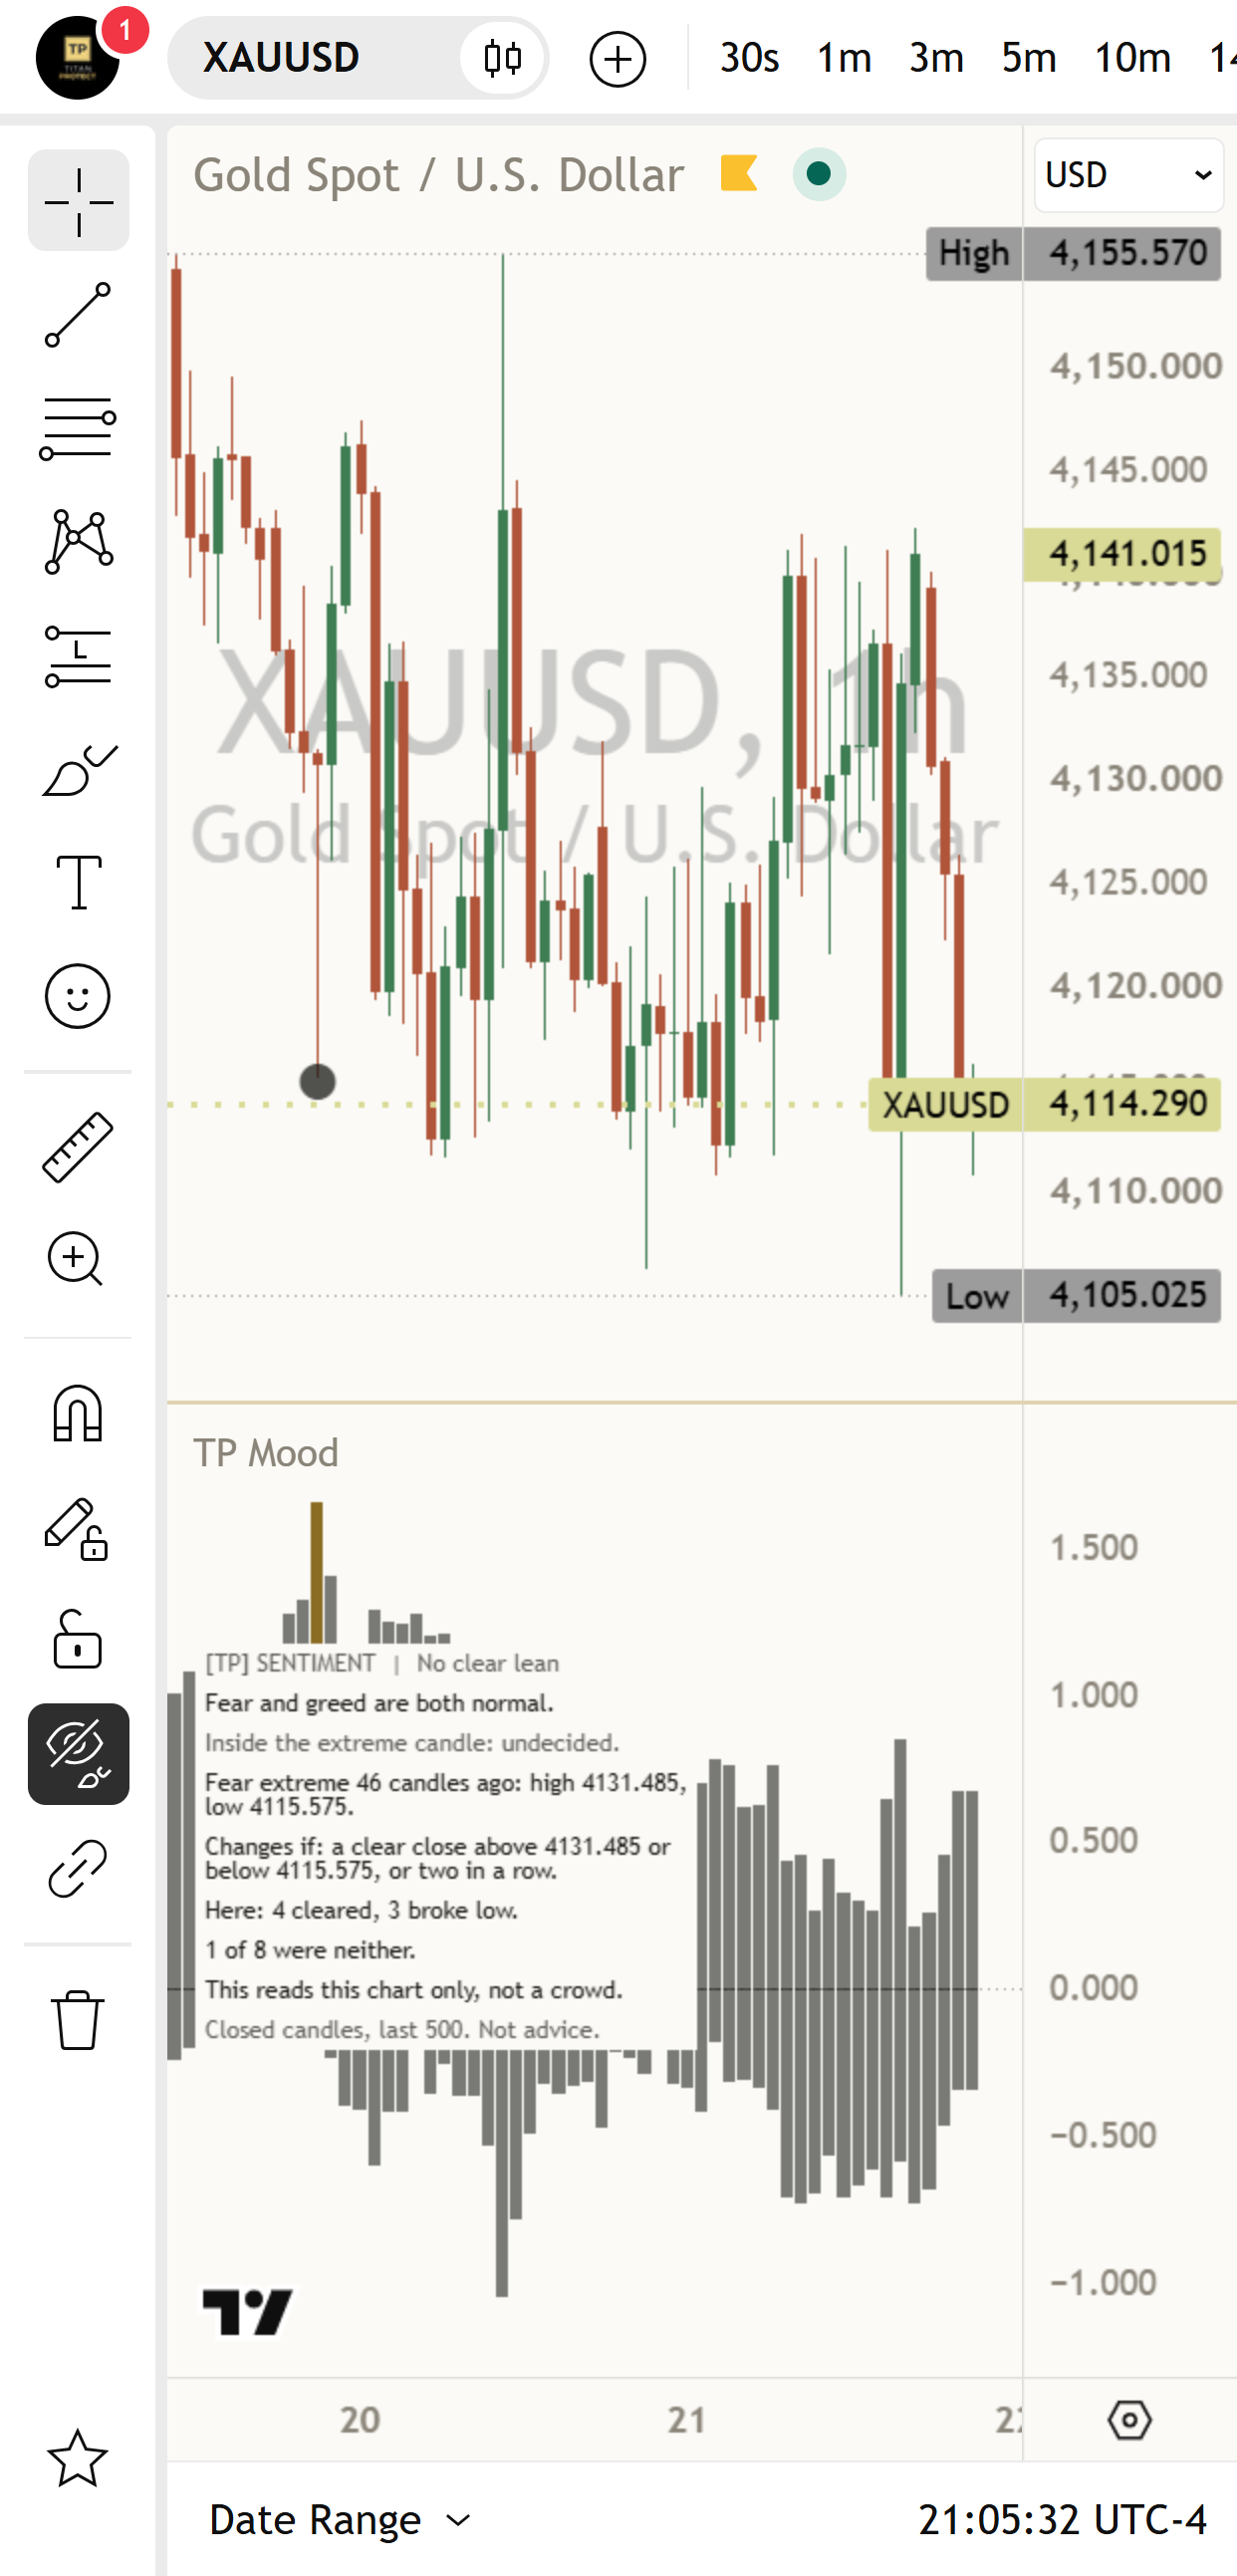
A good way to use it: say what you see first: is fear or greed extreme, high or normal? After an extreme, say what you expect, then watch the ten candles: cleared its high, broke its low, or neither? Then check where the close sits against the extreme candle's high and low, and read this chart's count, both ways. Where you disagree is where you learn.
Test yourself
Take the 15-question quiz below to check what stuck.
Question 1 of 15 · Beginner
In this lesson, what does the fear reading measure?
Question 2 of 15 · Beginner
How is the greed reading built?
Question 3 of 15 · Beginner
How is this reading different from the Fear and Greed Index?
Question 4 of 15 · Beginner
A fear column is very tall. What does that tell you for certain?
Question 5 of 15 · Beginner
Why does the indicator colour fear and greed extremes the same gold?
Question 6 of 15 · Intermediate
When is a reading called extreme?
Question 7 of 15 · Intermediate
Fear stays in its top tenth for six candles in a row. How many events are counted?
Question 8 of 15 · Intermediate
After an extreme, what decides the outcome?
Question 9 of 15 · Intermediate
Why is "neither" more common after extremes than after ordinary candles?
Question 10 of 15 · Intermediate
A long wick pokes above the extreme candle's high, then the candle closes back inside. What is the outcome so far?
Question 11 of 15 · Advanced
On your one-hour chart the panel reads "Here: 6 cleared, 7 broke low." after fear extremes. What does that tell you?
Question 12 of 15 · Advanced
The newest extreme was a fear extreme. Three candles later a candle closes above that extreme candle's high. What does the Mentor's header read?
Question 13 of 15 · Advanced
The panel reads "Here: 2 cleared, 9 broke low." Where do those numbers come from?
Question 14 of 15 · Expert
The panel reads "Greed spike reversed: below its low." and "Changes if: two closes inside in a row, or a clear close above 4040.00." (worked example). How should you read it?
Question 15 of 15 · Expert
The fear reading is extreme and RSI is oversold on the same candle. How many independent reasons is that?
Educational interpretation only. Not financial advice. Every reading comes from candles that already closed, and the counts are history, not promises about what comes next.
Learn the idea here. Apply it with the desk.
Titan Protect turns lessons like this into a daily practice: live market research, the full framework, and the tools that put it to work. This lesson is free; the desk is where it compounds.