
Titan Tactics
Every number in the prior briefs comes down to this: where do you enter, where do you stop, and where do you take profit? This is the tactical blueprint for the week ahead. The levels below are derived from structural analysis, cross-referenced with institutional flow data, the basis structure, and the commodity divergence.
Three clean setups are mapped with full parameters. Monday’s session structure is assessed for gap risk and opening range potential.
Friday’s global equity strength creates tactical opportunities across sessions. The FTSE 100 and DAX 40 tracked US strength into the European close, setting up potential continuation or gap-fill setups for Monday’s London open. The Nikkei 225 and Hang Seng carried momentum through Asia, which often sets the tone for pre-market direction. The Euro Stoxx 50 confirmed broad participation, reducing the risk of false breakouts. ASX 200 steadiness with commodity tailwinds suggests resource sector setups remain active. The mixed signals from Nifty 50 and China A50 flag regional setups that may diverge from the Western equity bid.
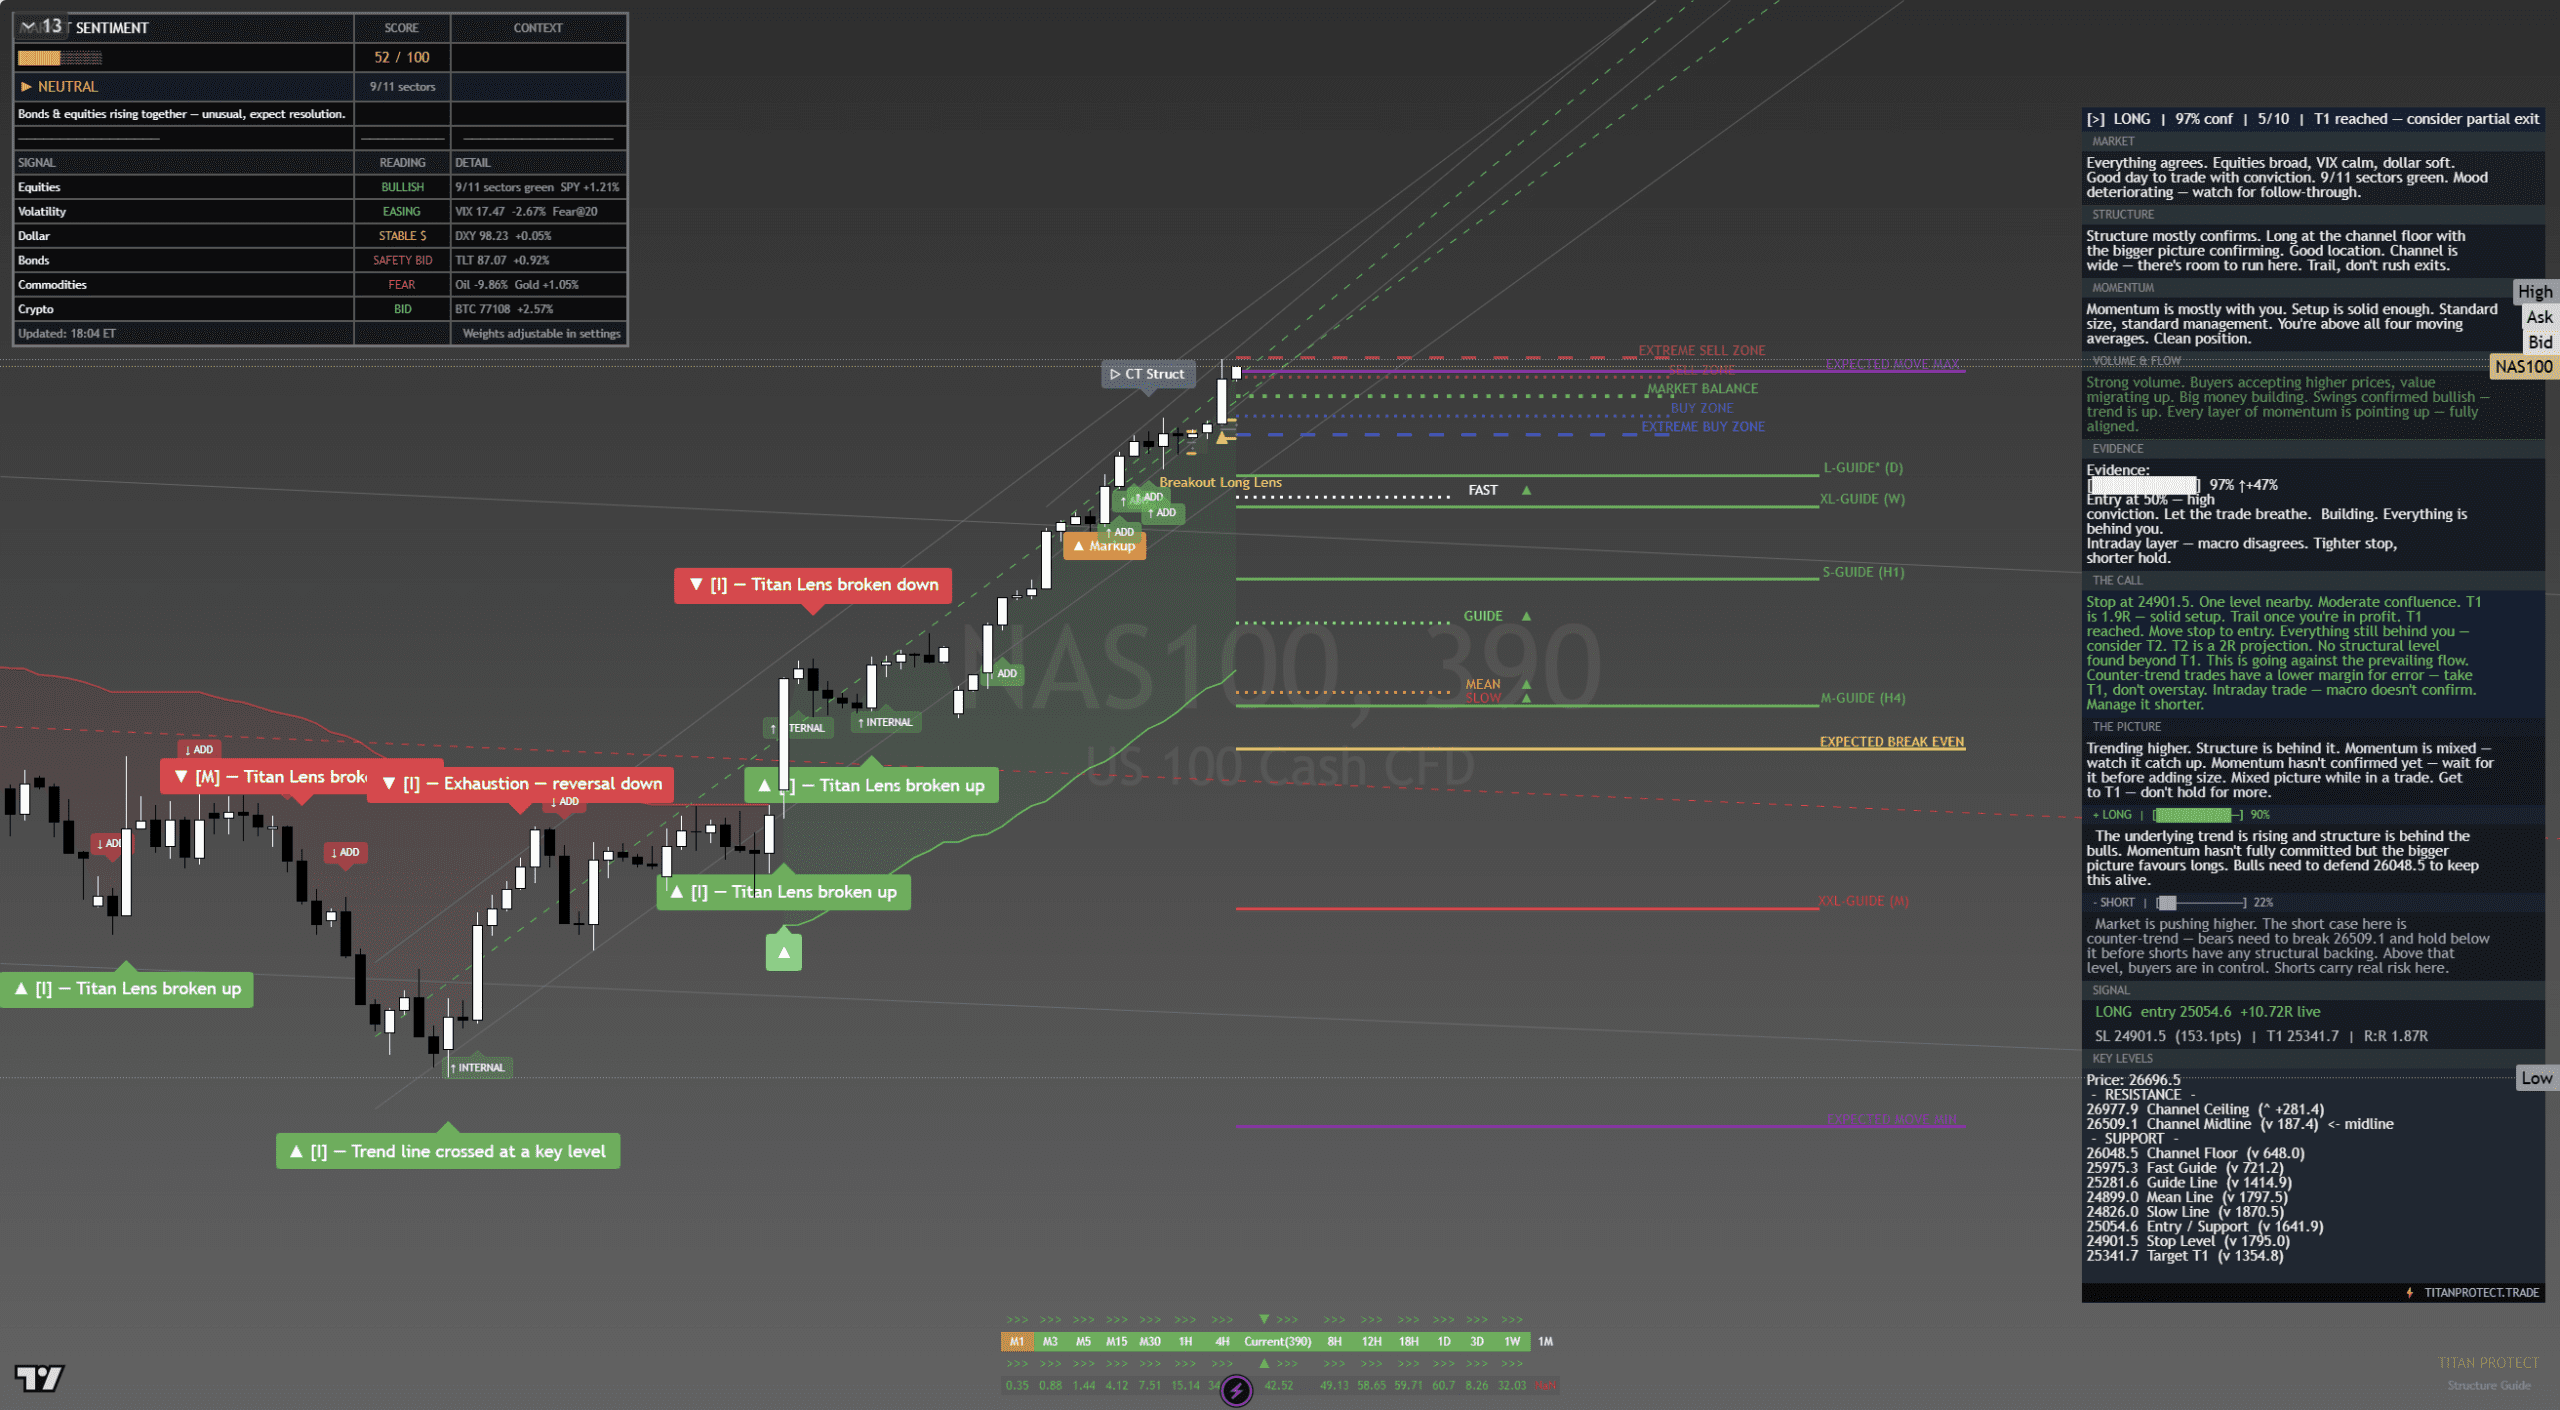
Nasdaq 100 (QQQ) Level Map
| Price | Level Type | If Above | If Below |
|---|---|---|---|
| 26,978 | Resistance 1 (weekly high) | Breakout continuation toward 27,200. Thin air above | Rejection means distribution. Expect pullback to 26,736 |
| 26,841 | Friday close | Holding above mid-range. Bias remains long | Below Friday close signals overnight seller |
| 26,736 | Support 1 (prior breakout) | Former resistance becomes support. Dip-buy zone | Breakdown signals deeper correction to 26,509 |
| 26,509 | Support 2 (weekly VWAP) | Healthy pullback territory. Swing entry zone | Below VWAP means sellers in control |
| 26,348 | Support 3 (structural mid) | Still within range. Buyers should be present | Break signals weekly trend reversal |
| 25,975 | Support 4 (major structure) | Deep pullback but structure intact | Invalidates bullish thesis. Defensive positioning |
| 25,055 | Support 5 (200-day area) | Major correction territory | Trend break confirmed. Cash is a position |
S&P 500 (SPY) Level Map
| Price | Level Type | Scenario |
|---|---|---|
| 715.00 | Resistance (52-week high extension) | Breakout target. Above here, price discovery begins |
| 710.14 | Friday close | At 99th percentile. Stretched but trending |
| 705.00 | Support 1 (prior breakout) | First dip-buy zone |
| 701.00 | Support 2 (max pain) | Options market makers defend this level. Strong support |
| 695.00 | Support 3 (structural floor) | Below max pain signals distribution. Defensive hedging required |
Setup Card 1: Nasdaq 100 Breakout Continuation
| Instrument | Nasdaq 100 (QQQ) — futures or CFD |
| Direction | Long |
| Entry | 26,978 on confirmed break (30-min close above) |
| Stop | 26,840 (below Friday close, 138 points) |
| Target 1 | 27,150 (172 points, +1.2:1 R:R) |
| Target 2 | 27,350 (372 points, +2.7:1 R:R) |
| Size | Standard |
| Invalidation | If price rejects 26,978 twice on heavy volume, step aside |
Breakout above weekly resistance with institutional backing, dark pool confirmation, and contango carry. If 26,978 breaks, there is no meaningful resistance until 27,200.
Setup Card 2: S&P 500 (SPY) Dip-Buy at Max Pain
| Instrument | S&P 500 (SPY) — cash or options |
| Direction | Long |
| Entry | 701-703 (max pain zone) |
| Stop | 698.50 (below max pain, 2.50-4.50 point risk) |
| Target 1 | 708 (5-7 points, +1.5:1 R:R) |
| Target 2 | 713 (10-12 points, +2.8:1 R:R) |
| Size | Full conviction |
| Invalidation | If S&P 500 (SPY) trades below 698 on heavy volume, close and reassess |
Max pain at 701 means market makers must buy to hedge. Dark pool prints at $9.42B confirm institutional demand. 3.5:1 call/put ratio means the street is positioned for upside. Highest-conviction setup.
Setup Card 3: Gold Trend Continuation
| Instrument | Gold (GC futures or GLD) |
| Direction | Long |
| Entry | 4,800-4,820 (pullback to prior breakout) |
| Stop | 4,770 (30-50 point risk) |
| Target 1 | 4,880 (60-80 points, +1.6:1 R:R) |
| Target 2 | 4,950 (130-150 points, +3:1 R:R) |
| Size | Standard |
| Invalidation | If Gold trades below 4,750 on dollar strength, close and wait |
Institutional positioning at +35K, dollar weakness, Silver leading Gold (ratio compression), and contango carry. As you’ll find in our Raw Materials brief, Gold has a triple tailwind. Buying a pullback to the breakout zone is the textbook entry.
Weekend Gap Risk Assessment
| Factor | Assessment |
|---|---|
| IMF/World Bank meetings Monday | Moderate risk. Gap probability: around 30% |
| Geopolitical (Middle East, Taiwan) | Low-moderate. Gap probability: around 15% |
| Crypto 24/7 pricing | Bitcoin (BTC) below 74,000 over weekend = expect equity gap-down Monday |
| Volatility term structure | Contango at 2.9pts. Market is not pricing a gap |
| Overall gap probability | Around 35% chance of gap greater than 0.5%. Lean toward gap-up |
Gap up 0.5%+: Do not chase. Wait for the first 30-minute range. Buy the pullback to the opening range low.
Gap down 0.5-1%: Buy the gap-fill. Positioning and dark pool flow say dip buyers are present. Target a return to Friday’s close.
Gap down 1%+: Wait. A move of that size on a weekend catalyst means the thesis needs re-evaluation. Do not buy until the first hour’s range is established.
Monday Session Structure
Pre-market (4:00-9:30 ET): IMF/World Bank headlines dominate. Thin liquidity, headline-driven whipsaws. Do not trade aggressively.
Opening range (9:30-10:00 ET): First 30 minutes establish the session’s range. In a bullish environment, the opening range low becomes support for the rest of the day.
Mid-session (10:00-14:00 ET): Institutional flow shows up here. If the opening range holds, expect a grind higher.
Power hour (15:00-16:00 ET): Monday power hours after weekends with pending catalysts tend to be volatile. Expect the directional move here.
Risk Score — Tactical Environment
Experience Levels
Hedging Recommendations
1. Weekend gap hedge: S&P 500 (SPY) 705P (one-week expiry). Covers the IMF gap-down scenario.
2. Breakout failure: If Nasdaq 100 fails at 26,978, do not hold. The invalidation is clear. Accept the stop.
3. Gold correlation: If the Dollar Index (DXY) reverses above 99.00, Gold setup invalidates. Use DXY as the leading indicator for Setup 3.
4. Portfolio heat limit: If all three setups trigger, total heat should not exceed around 15% of total capital.
Market Timing Verdicts
| Timeframe | Verdict | Confidence |
|---|---|---|
| Monday specifically | Cautious until IMF clarity. Trade afternoon, not morning | Medium |
| Short-term (1-7 days) | Bullish bias with clear levels. Setups are tradeable | High |
| Medium-term (1-8 weeks) | Trend intact. 27,200+ Nasdaq 100 is the target | Medium-High |
Further Reading
As you’ll find in our Institutional Flow brief, S&P 500 (SPY) $9.42B dark pool is the reason Setup 2 is highest conviction.
As you’ll find in our Option Watch brief, max pain at 701 and 3.5:1 call/put ratio are the quantitative basis for Setup 2 entry.
As you’ll find in our Basis Edge brief, contango carry means holding overnight is rewarded, not penalised.
As you’ll find in our Raw Materials brief, Gold’s triple tailwind confirms Setup 3.
Related Intelligence
As you’ll find in our Setup Radar brief, where the technical setups feeding these tactics are identified.
For the full breakdown, see our Titan Signals brief — where real-time signal triggers activate these tactical plans.
What We Called vs What Happened
Starting this week, every Titan Tactics brief will include a track record section where we hold ourselves accountable. Our calls from the prior week will be listed alongside the actual market outcome, so you can see exactly how the analysis played out. Expect this section to grow each week with a running accuracy record.
This week’s calls are now on record. Check back in our next edition to see how they resolved.
This is analysis, not financial advice. Always manage your risk.
Monday gap risk moves from the base case 35% probability to closer to 60–70%. The Strait of Hormuz recorded zero oil tanker transits on Saturday — the first complete closure in history — after a US Navy strike on an Iranian cargo vessel and collapsed negotiations. The NAS100 26,978 resistance becomes less relevant if the market gaps down. The 26,509 support zone becomes the first test. Below 25,975 would signal geopolitical risk is being fully priced.
Deepen Your Understanding
Related articles from the Titan Protect Foundry: