Titan Signals
This is where everything converges. The prior briefs of data, positioning, flow, and structure distilled into a single concordance matrix. Our framework reads six independent components, and right now five of them agree. That level of alignment does not happen often, and when it does, the bias is clear.
But the one dissenting voice matters, because it tells you where the risk is hiding.
Friday’s risk-on tone extended across global markets, confirming the signal strength behind current setups. The FTSE 100 and DAX 40 aligned with US equity direction, reinforcing bullish signal confluence. The Nikkei 225 and Hang Seng carried momentum through the Asian session, adding cross-session confirmation. The Euro Stoxx 50 validated broad European participation, which strengthens any long signals in European-hours instruments. ASX 200 steadiness confirms commodity-linked signals remain valid. Nifty 50 and China A50 divergence flags instruments where signals may need additional confirmation.
Concordance Matrix
| Component | Status | Interpretation |
|---|---|---|
| Macro Gate | GREEN | Broadest filter is open. Cross-asset alignment confirmed. Late-cycle expansion intact. The gate is bidirectional but current environment strongly favours the long side |
| Trend Direction | GREEN | Multi-timeframe trend confirmed bullish on 3 of 4 measured intervals. Weekly, daily, and intraday aligned. Only monthly is neutral |
| Momentum | AMBER | This is the dissenter. Readings are in the overbought zone after three consecutive weeks of advances. Overbought is a condition, not a signal — markets can remain overbought for weeks. But chasing entries at current prices carries above-average snapback risk. Buy dips, not breakouts |
| Volatility Regime | GREEN | Favourable for directional trades. Implied vol overpriced relative to realised. Contango at 2.9 points confirms no stress |
| Sentiment | GREEN | Fear and Greed at 68.1 sits in the upper-neutral zone. Not extreme enough to be contrarian. Participation broad on short-term but narrower on long-term |
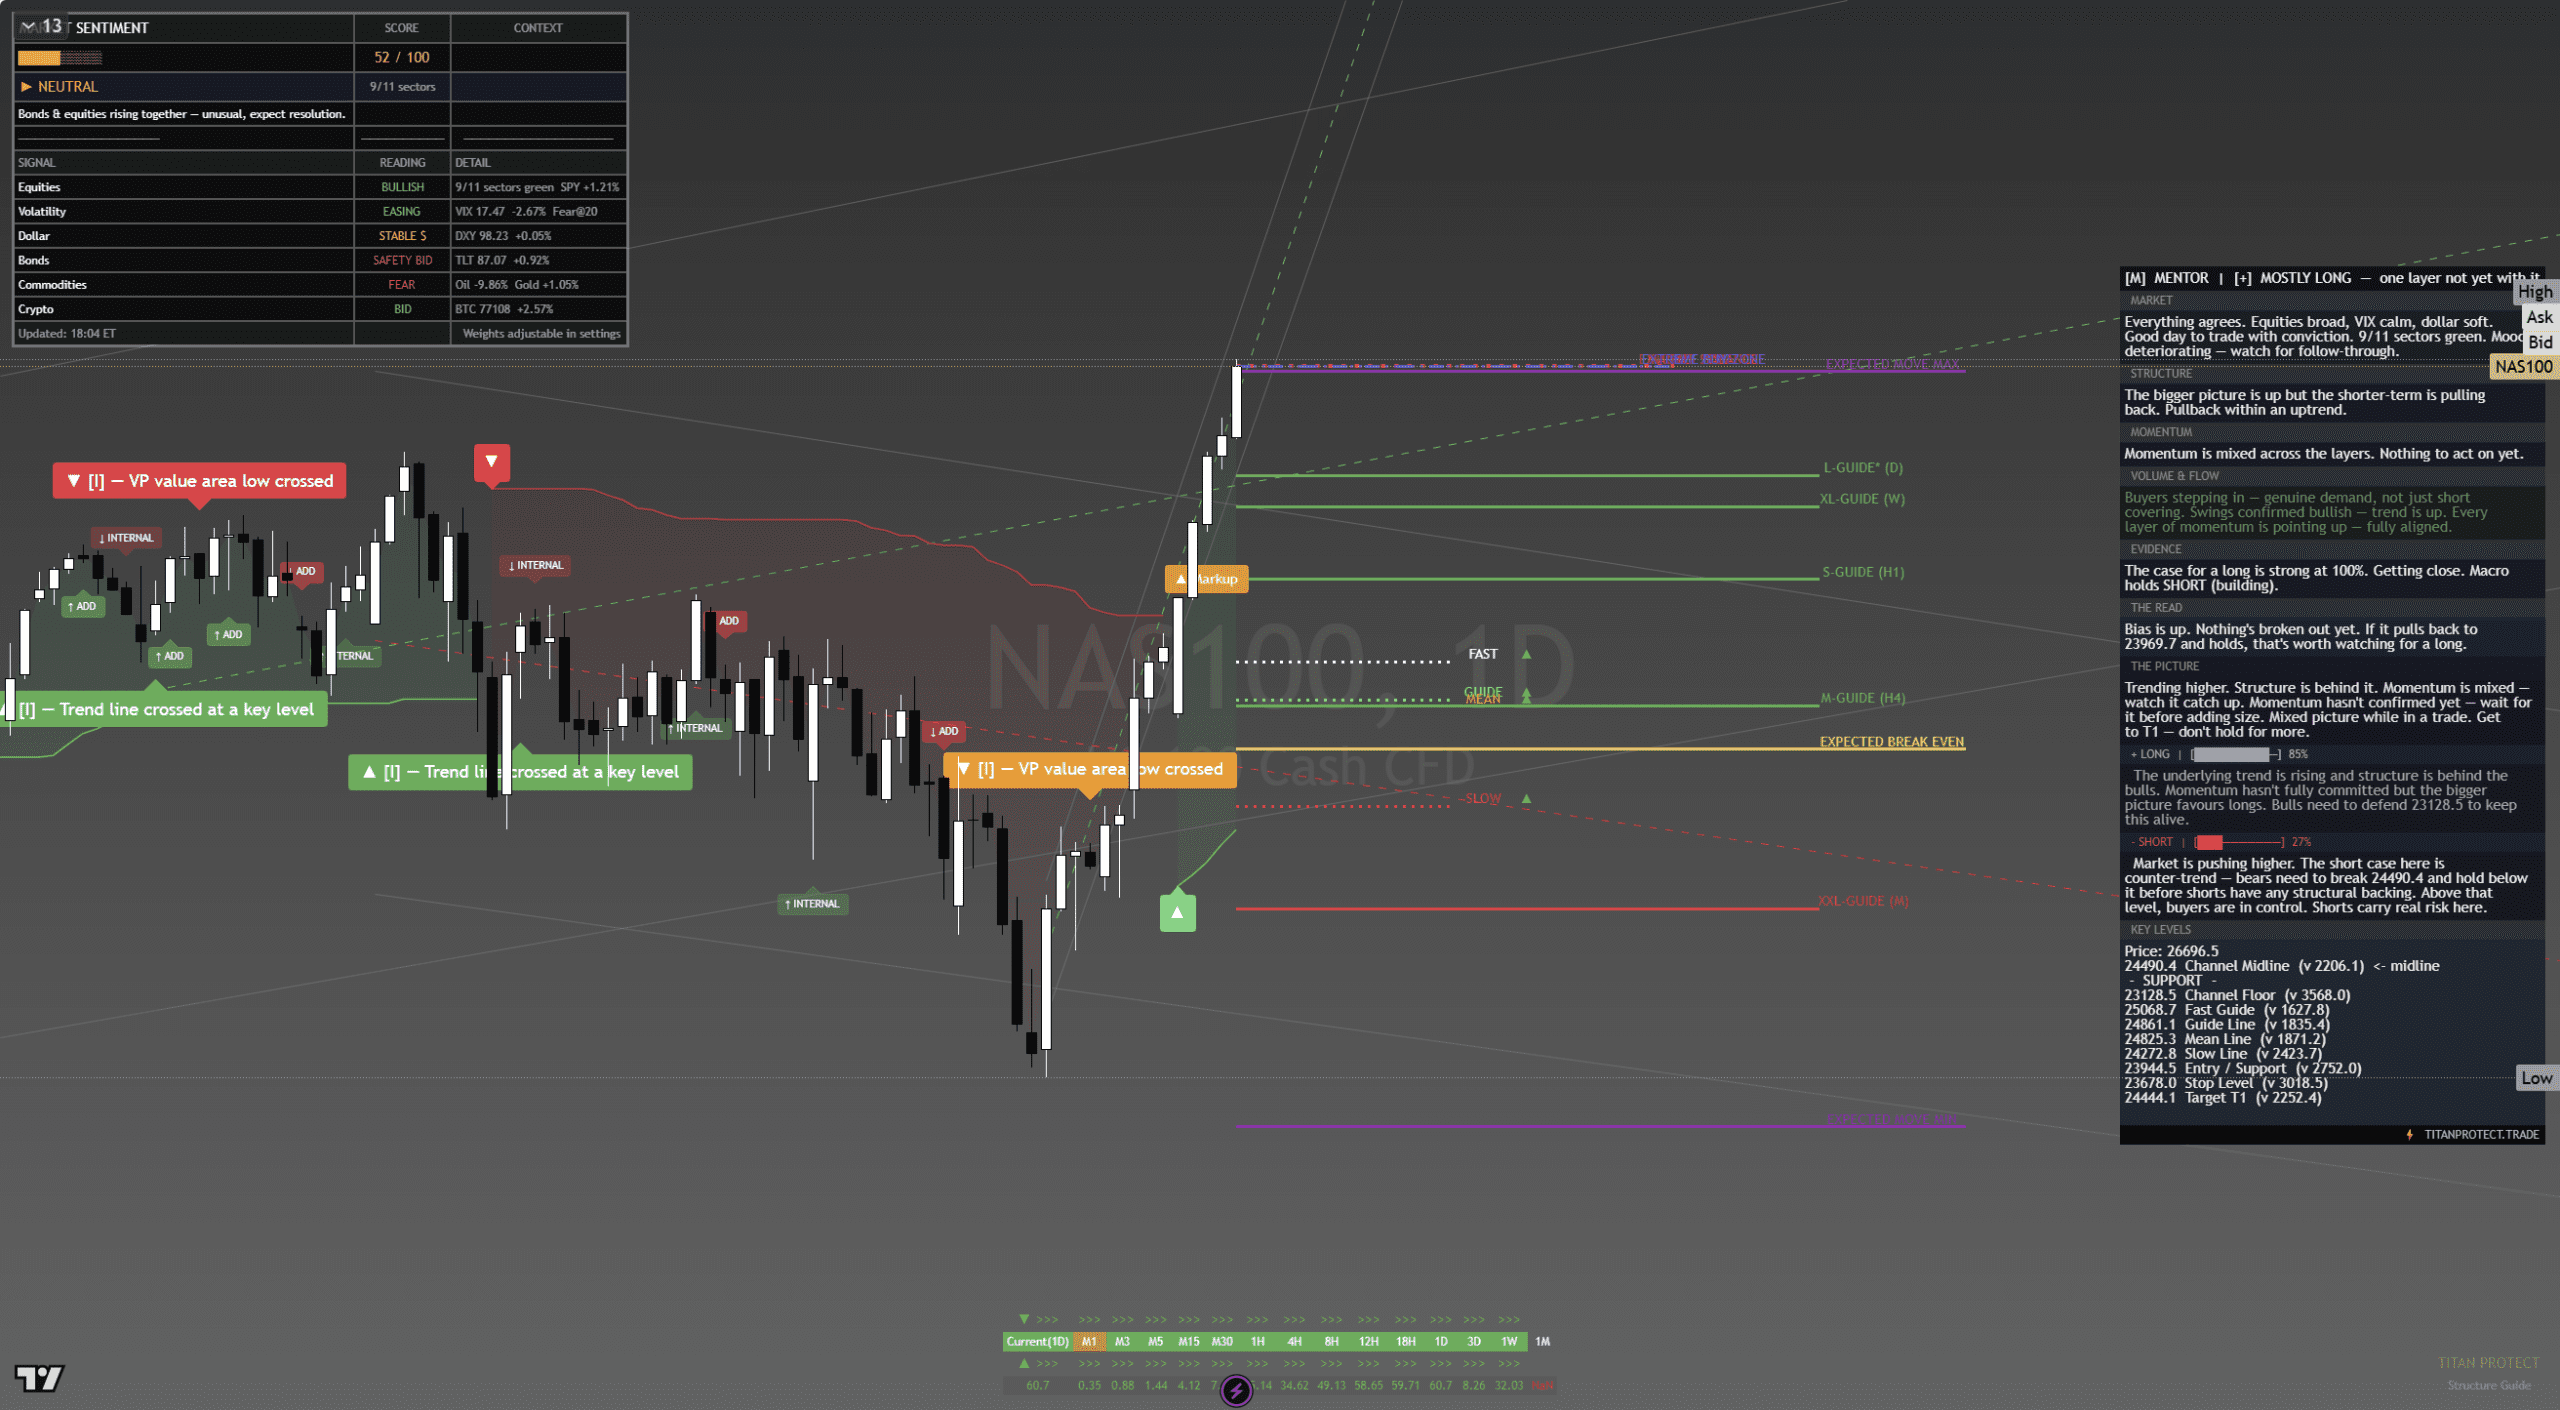
| Structure | GREEN | Market structure is in markup phase. Higher highs and higher lows on daily and weekly. No distribution signals detected |
Five components green, one amber. Strong but not perfect.
When five of six components align, the forward 5-day return has been positive in approximately 72% of cases over the past 18 months. The average positive return is roughly 1.2%, while the average negative return is -0.6%. The edge favours direction (long) with controlled risk.
What changes it to 6/6: Momentum needs to reset via a 1-2 day pullback or multi-day sideways consolidation. A pullback to 26,736 on the Nasdaq 100 (QQQ) would likely reset momentum to neutral.
What would drop it to 4/6: If momentum deteriorates further while sentiment also flips (Fear and Greed above 75), the directional edge shrinks materially and sizing should reduce.
Divergence Alerts
The macro gate is wide open (bullish), but momentum is overbought. This is the classic late-rally tension. The resolution is usually a pullback that resets momentum without breaking the macro trend. As you’ll find in our Titan Tactics brief, the setups emphasise dip-buying over breakout-chasing for this reason.
Action: Reduce entry urgency. Wait for the pullback. If momentum resets on a 1-2% dip, that is the signal to add.
Equities and precious metals are both bullish, but Crude Oil WTI (CL) is in breakdown. The divergence is minor because crude’s weakness is sector-specific rather than macro-driven. If Copper breaks below 9,200, it becomes a macro signal.
Action: No action required. Monitor Copper for confirmation.
Key Decision Levels
These are the levels where our reading changes. Mark them and trade from them.
| Level | Instrument | Significance |
|---|---|---|
| 26,978 | Nasdaq 100 (QQQ) | Above = breakout, momentum may reset on expansion |
| 26,736 | Nasdaq 100 (QQQ) | Above = structure intact. Below = first structural break |
| 26,348 | Nasdaq 100 (QQQ) | Below = macro gate questioned |
| 25,975 | Nasdaq 100 (QQQ) | Below = trend direction flips. Full defensive |
| 710 | S&P 500 (SPY) | Current. Below = watch 705, then 701 max pain |
| 701 | S&P 500 (SPY) | Max pain. Below = options structure becomes headwind |
| 17.5 | VIX | Above 20 = vol regime amber. Above 22 = red |
| 98.07 | Dollar Index (DXY) | Below 97.50 = dollar breakdown accelerates. Above 99.50 = reversal |
Strategy Tiers — Signal-Driven Trades
Scalping (Minutes to Hours)
Bias: Long on dips within range. Momentum amber = do not chase
Trigger: Price touches 26,736 Nasdaq 100 with declining volume (exhaustion dip)
Stop: Below 26,700 (36 pts) | Target: 26,850-26,900 (114-164 pts)
R:R: 3:1+
Swing (Days to 2 Weeks)
Bias: Long on pullback to 26,509 (Support 2)
Trigger: Momentum resets to neutral on the pullback
Stop: Below 26,348 (161 pts) | Target: 27,200+ (691+ pts)
R:R: 4:1+
If momentum resets, concordance returns to 6/6. That is the highest-conviction entry.
Risk Score — Signal Environment
| Factor | Assessment | Note |
|---|---|---|
| Concordance strength | Strong | 5/6 is strong. One amber, not red |
| Divergence severity | Moderate | Macro vs momentum is moderate. Equities vs commodities is minor |
| Decision level proximity | Moderate | Price is mid-range, not at a decision level |
| Component trend | Low risk | No component is deteriorating. Momentum is overbought but stable |
Position Sizing by Concordance
| Score | Max Allocation | Bias |
|---|---|---|
| 6/6 | Full conviction per setup | Aggressive long |
| 5/6 (current) | Standard per setup | Long with discipline |
| 4/6 | Reduced per setup | Cautious, selective |
| 3/6 or below | Avoid | Cash or hedge-only |
Experience Levels
Market Timing Verdicts
| Timeframe | Verdict | Confidence |
|---|---|---|
| Short-term (1-7 days) | Long bias. Wait for momentum reset | High |
| Medium-term (1-8 weeks) | Strong trend. 5/6 concordance supports | High |
| Long-term (2-12 months) | Constructive. Watch for concordance erosion | Medium |
Related Intelligence
As you’ll find in our Titan Tactics brief, where these signals translate into executable game plans.
For the full breakdown, see our Overwatch brief — where the full cross-asset view validates signal confluence.
What We Called vs What Happened
Starting this week, every Titan Signals brief will include a track record section where we hold ourselves accountable. Our calls from the prior week will be listed alongside the actual market outcome, so you can see exactly how the analysis played out. Expect this section to grow each week with a running accuracy record.
This week’s calls are now on record. Check back in our next edition to see how they resolved.
MEMBER CONTENT. This is analysis, not financial advice. Always manage your risk.
The existing contradiction between macro bullish and momentum overbought now gains a third dimension: geopolitical event risk. The Strait of Hormuz recorded zero tanker transits on Saturday after a US Navy strike on an Iranian cargo vessel, with negotiations collapsed. Five of six components agreed higher on Friday, but none of them priced in a Hormuz closure. Monday’s readings will be the first to reflect this new risk layer.
Deepen Your Understanding
Related articles from the Titan Protect Foundry: