Setup Radar: Weekend Edition
Tactical Radar | Published for the week ahead | Friday 17 April 2026
The week closed with the S&P 500 (SPY) at 7,126, touching 710.14 against a 52-week high of 712.36, and the Russell 2000 (IWM) outperforming everything at +2.13%. That final print matters. When small caps lead into a weekend with this kind of margin, Monday’s open becomes a test of follow-through.
The watchlist below is built from Friday’s close, ranked by priority and structured for four trading styles. Every entry references the macro and positioning context from the earlier briefs — specifically the broad bullish alignment across assets, the heavily skewed call-to-put ratio, and the institutional accumulation pattern that dominated the session.
Watchlist — 18 Setups for Monday 21 April
| # | Instrument | Price | Weekly Chg | Setup Type | Bias | Entry Zone | Stop | Target | R:R |
|---|---|---|---|---|---|---|---|---|---|
| 1 | S&P 500 (SPY) | 710.14 | +1.20% | Breakout continuation | Long | 708–710 | 704.50 | 718.00 | 1.6:1 |
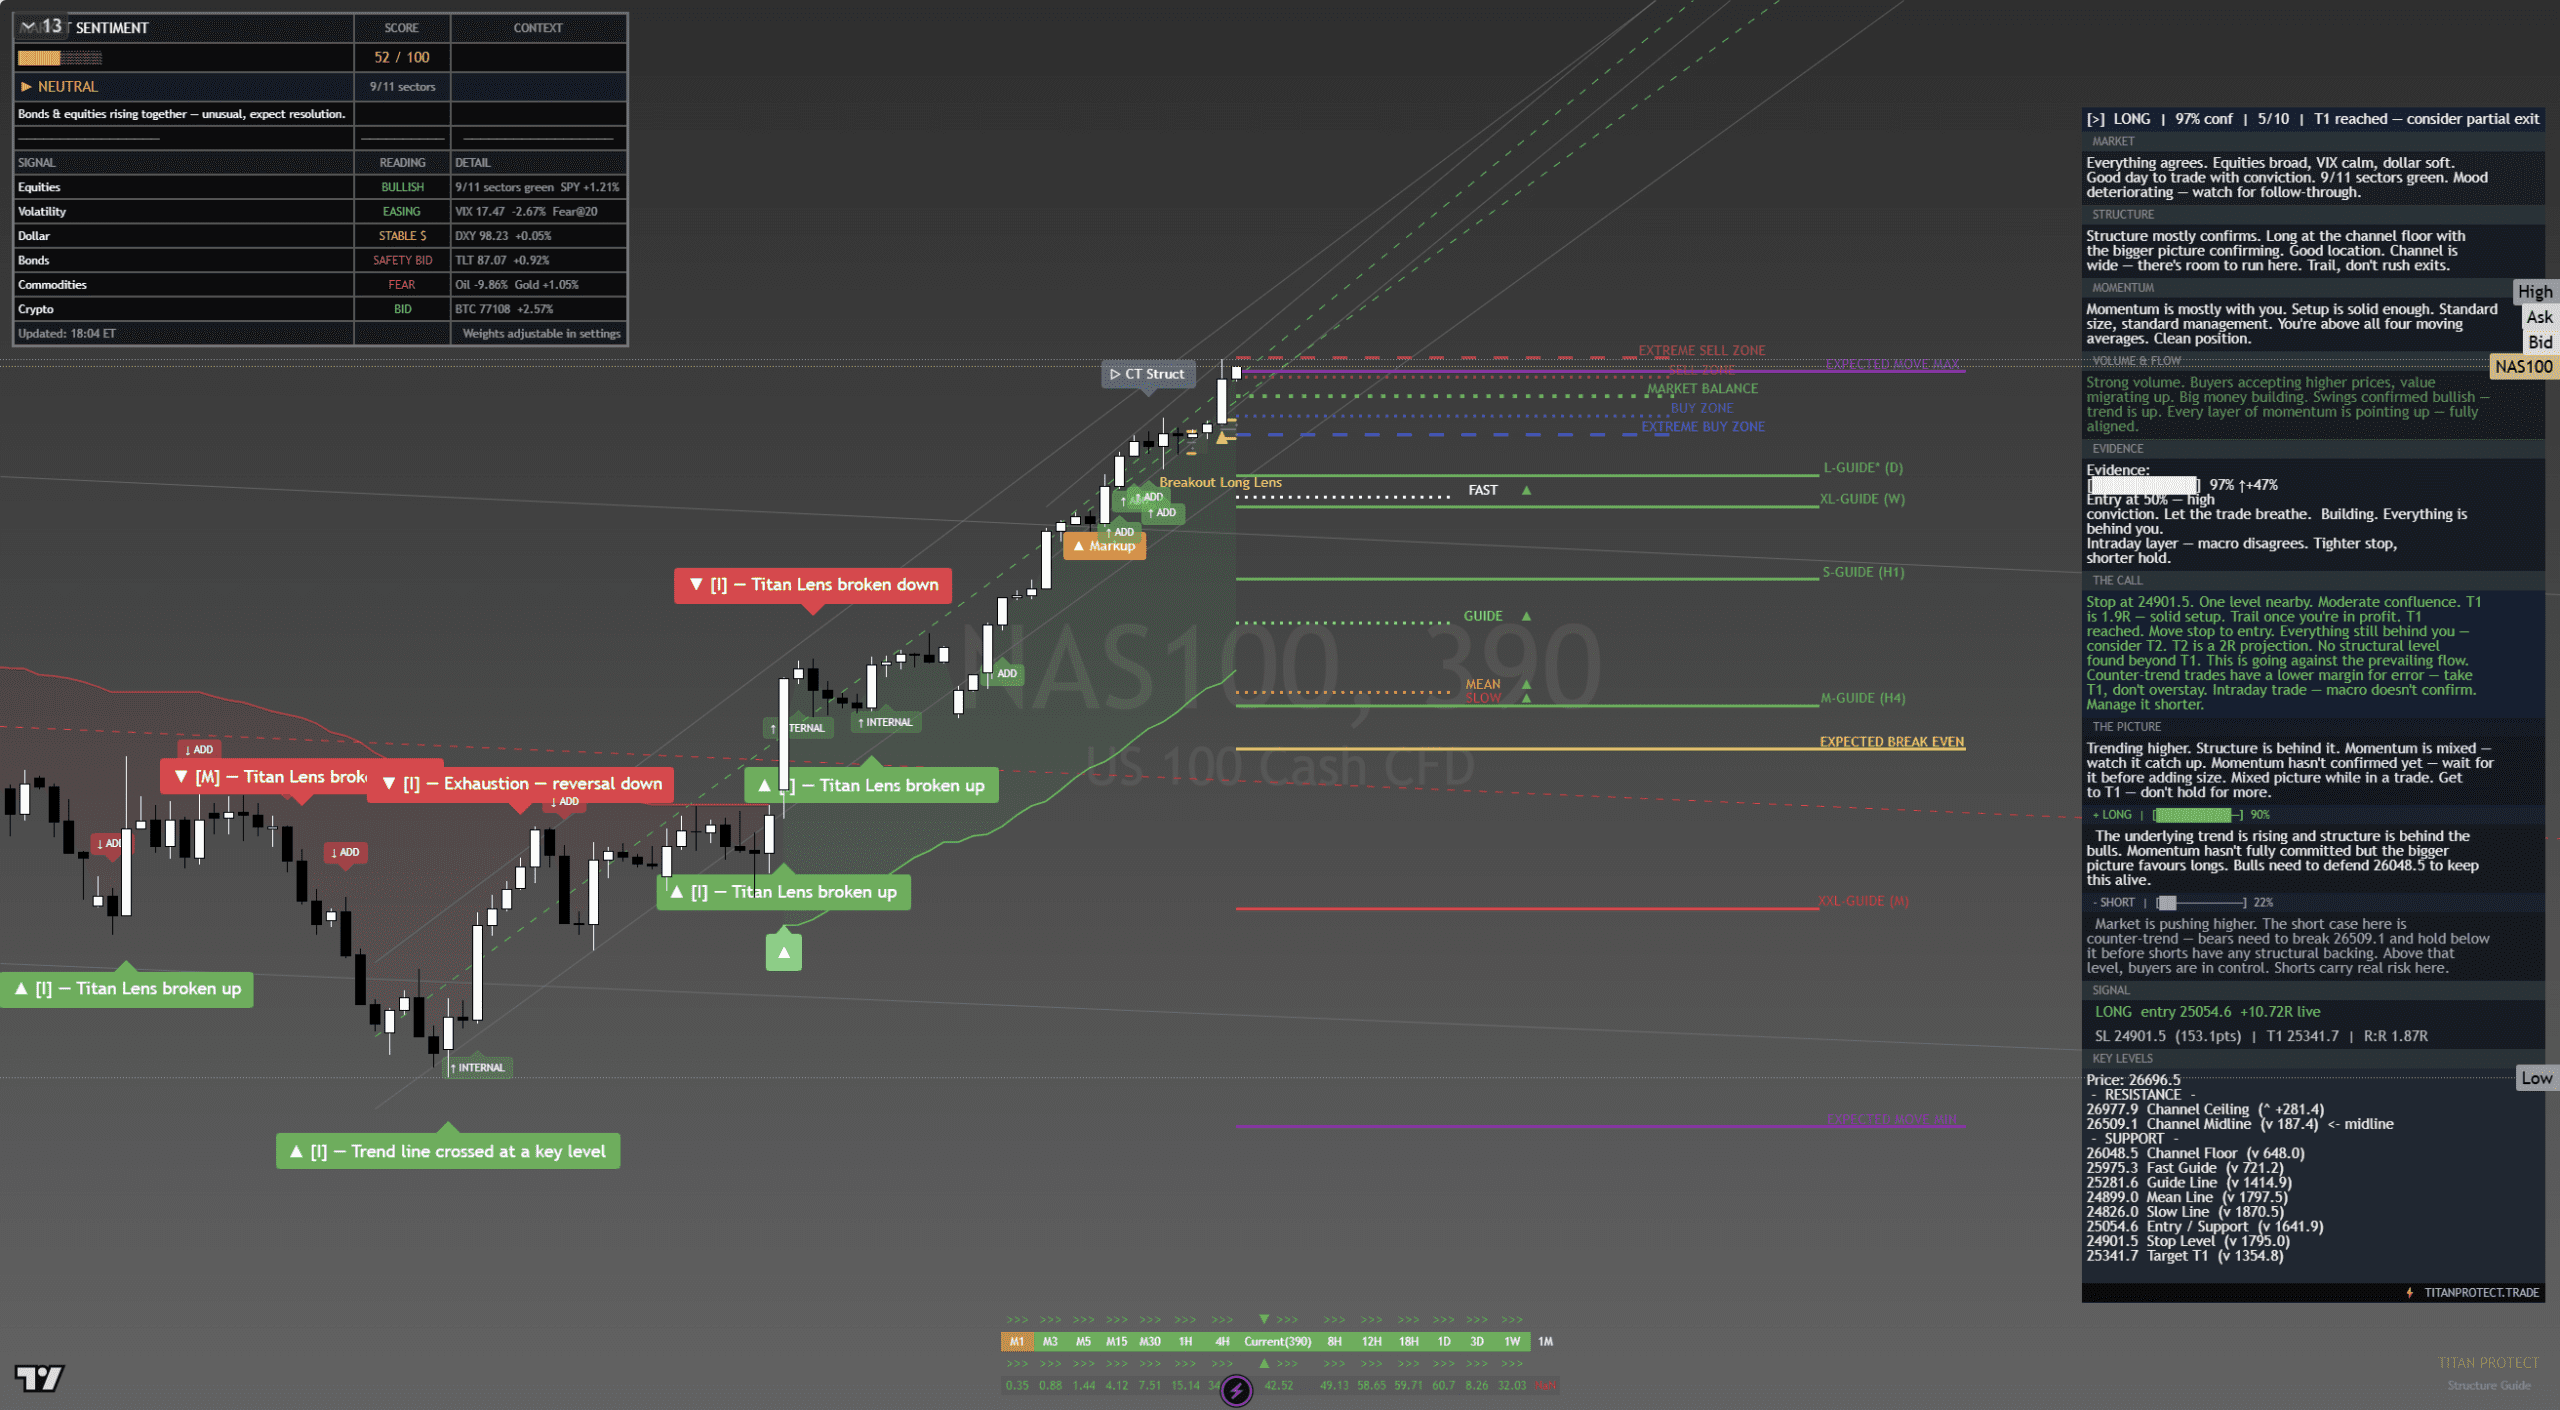
| 2 | Nasdaq 100 (NAS100) | 24,468 | +1.50% | Momentum pullback | Long | 24,300–24,400 | 24,100 | 24,900 | 1.7:1 |
| 3 | Russell 2000 (IWM) | 278.80 | +2.13% | Breakout leader | Long | 276–278 | 273.00 | 286.00 | 1.6:1 |
| 4 | NVIDIA (NVDA) | — | — | Algorithmic accumulation | Long | Prior close dip | -3% | +5% | 1.7:1 |
| 5 | Gold (XAUUSD) | 4,849 | +1.48% | Trend continuation | Long | 4,800–4,830 | 4,750 | 4,950 | 1.5:1 |
| 6 | Apple (AAPL) | — | — | Core rebalancing | Long | Prior close dip | -2.5% | +4% | 1.6:1 |
| 7 | Tesla (TSLA) | — | — | Accumulation squeeze | Long | Prior close dip | -4% | +6% | 1.5:1 |
| 8 | Meta Platforms (META) | — | — | Targeted accumulation | Long | Prior close dip | -3% | +4.5% | 1.5:1 |
| 9 | Silver (XAGUSD) | 80.93 | +3.98% | Momentum extension | Long | 79.50–80.50 | 77.80 | 84.00 | 1.5:1 |
| 10 | Amazon (AMZN) | — | — | Tech rotation | Long | Prior close dip | -2.5% | +4% | 1.6:1 |
| 11 | Bitcoin (BTC) | 77,031 | +3.27% | Risk-on confirmation | Long | 75,500–76,500 | 73,500 | 80,000 | 1.3:1 |
| 12 | Microsoft (MSFT) | — | — | Broad tech base | Long | Prior close dip | -2% | +3.5% | 1.8:1 |
| 13 | Invesco QQQ (QQQ) | — | +1.50% | Breakout pullback | Long | Max pain 635 zone | -2% | +3.5% | 1.8:1 |
| 14 | AMD (AMD) | — | — | Semi follow-through | Long | Prior close dip | -4% | +6% | 1.5:1 |
| 15 | Crude Oil (CL) | 84.00 | -9.41% | Mean reversion bounce | Long (counter) | 82.00–83.50 | 80.00 | 88.00 | 1.3:1 |
| 16 | EUR/USD | 1.176 | — | Dollar weakness play | Long | 1.172–1.174 | 1.168 | 1.184 | 1.7:1 |
| 17 | GBP/USD | 1.351 | — | Structural long | Long | 1.347–1.349 | 1.343 | 1.360 | 1.5:1 |
| 18 | Copper (HG) | 6.08 | +0.63% | Industrial confirmation | Long | 6.00–6.05 | 5.90 | 6.25 | 1.3:1 |
Global Index Context
| Index | Region | Relevance to Monday |
|---|---|---|
| FTSE 100 | UK | Sterling strength (GBP/USD 1.351) supports FTSE exporters less, but commodity-heavy index benefits from gold and metals bid |
| DAX 40 | Germany | Euro consolidation and export-heavy composition make DAX sensitive to any IMF rhetoric on European growth |
| Euro Stoxx 50 | Eurozone | Broad European benchmark tracks DAX sentiment; EUR/USD consolidation creates a neutral backdrop |
| CAC 40 | France | Luxury and industrial exposure means CAC follows the cyclical rotation theme |
| Nikkei 225 | Japan | Yen weakness typically lifts Nikkei; dollar decline may strengthen yen and create headwinds |
| Hang Seng | Hong Kong | China tech sentiment and dollar weakness are supportive; watch for Asia-session risk appetite |
| ASX 200 | Australia | Mining and commodity-heavy index benefits directly from gold and copper strength |
| Nifty 50 | India | Domestic growth story relatively insulated from US macro; dollar weakness is a tailwind |
| China A50 | China | Stimulus expectations and dollar weakness provide a supportive backdrop for mainland equities |
Rationale by Priority
Multi-Strategy Breakdown
Risk Assessment
Factors driving the assessment:
- Broad cross-asset bullish alignment reduces risk — most major assets are moving in the same direction
- S&P 500 (SPY) within 2 points of all-time high creates binary breakout or rejection risk
- Institutional accumulation is broad and consistent, which reduces the chance of a sudden reversal
- Short-term breadth is strong (71% above 50-day) but longer-term breadth lags (52.3% above 200-day), adding structural fragility
- IMF meetings Monday introduce event risk that could shift sentiment quickly
- Crude oil’s 9.41% weekly decline creates correlation risk if it reverses sharply
Scenario Analysis
| Scenario | Probability | Description | Action |
|---|---|---|---|
| Bullish breakout | 45% | SPY clears 712.36, Russell follows, breadth expands. IMF rhetoric neutral | Full watchlist engaged. MAX sizing on top 5 |
| Consolidation | 30% | SPY holds 706–712, digests the weekly move, waits for mid-week catalyst | STANDARD sizing. Scalp and intraday only |
| Pullback to support | 20% | IMF downgrades spook sentiment, SPY fades to 700–704. Institutional flow holds | REDUCED sizing. Wait for support confirmation |
| Risk-off reversal | 5% | IMF shock + crude reversal triggers unwind. SPY below 700. Volatility spike | AVOID new longs. Hedge existing positions |
Position Sizing Guide
| Scenario | Sizing | Application |
|---|---|---|
| MAX | Full position, aggressive entries | Breakout confirmed. SPY above 712.36 with volume |
| STANDARD | Normal position, defined risk | Range-bound. Clear stop levels respected |
| REDUCED | Half position or less | Event uncertainty high. Wider stops needed |
| AVOID | No new entries | Risk-off signals confirmed. Capital preservation |
Experience Level Guide
Hedging Recommendations
- Long equity exposure: Volatility calls or SPY puts at the 700 strike provide downside insurance for around 2–3% of portfolio cost
- Gold/silver longs: Hedge with a small dollar-long position as a reversal offset
- Crude counter-trend long: Tight stop below 80. No hedging needed — the stop IS the hedge
- Full portfolio: A 5% allocation to short-term treasury ETFs provides stability without opportunity cost in this rate environment
Market Timing Verdicts
| Timeframe | Verdict | Rationale |
|---|---|---|
| Short term (1–3 days) | Bullish with caution | IMF Monday is the swing factor. Institutional flow supports but event risk is real |
| Medium term (1–3 weeks) | Bullish | Broad alignment, strong positioning, momentum intact across equities and metals |
| Long term (1–3 months) | Bullish but late-cycle | Late-cycle expansion means upside continues but the easy gains narrow |
Further Reading
- As you’ll find in our Positioning Pressure brief, the speculative positioning table confirms the long equity / short crude / long gold theme that drives priorities 1–5 and 15 on this watchlist
- As you’ll find in our Macro Pulse brief, cross-asset alignment and late-cycle expansion context shape the scenario probabilities above
- As you’ll find in our Sentiment Shift brief, sentiment supports risk-on but the contrarian reading warns against crowded positioning
- As you’ll find in our Volatility Lens brief, contango and overpriced equity volatility mean hedges are cheap relative to realised moves
Related Intelligence
As you’ll find in our Titan Tactics brief, where we translate these setups into specific tactical game plans.
For the full breakdown, see our Hot Zones brief — where sector and regional heat maps highlight where these setups cluster.
What We Called vs What Happened
Starting this week, every Setup Radar brief will include a track record section where we hold ourselves accountable. Our calls from the prior week will be listed alongside the actual market outcome, so you can see exactly how the analysis played out. Expect this section to grow each week with a running accuracy record.
This week’s calls are now on record. Check back in our next edition to see how they resolved.
This is analysis, not financial advice. Always manage your risk.
Monday’s setups need recalibrating for geopolitical event risk. The Strait of Hormuz recorded zero oil tanker transits on Saturday after a US Navy strike on an Iranian cargo vessel, with negotiations collapsed and escalation rhetoric intensifying. Crude oil becomes a potential long setup as the -9.4% move faces a supply shock reversal. Gold becomes a priority long on safe haven demand. Equity index longs need wider stops to account for gap-down risk on the open.
Deepen Your Understanding
Related articles from the Titan Protect Foundry: