Breakout Trading: Capturing Explosive Momentum
Breakouts represent some of the most powerful opportunities in trading. When price escapes a consolidation zone, momentum often accelerates dramatically, creating substantial profit potential in short periods. However, breakouts also trap the unwary with false moves that quickly reverse. This article provides a complete framework for identifying, entering, and managing breakout trades with precision.

Understanding Breakouts
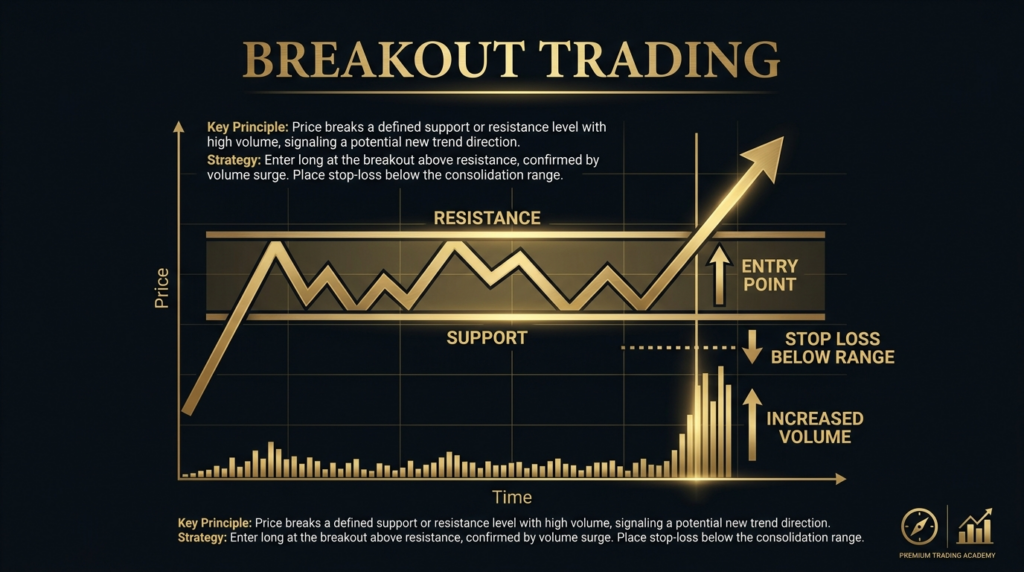
A breakout occurs when price moves beyond a defined boundary. typically a support or resistance level that has contained price action for a period. This boundary might be a horizontal level, a trend line, or the boundary of a technical pattern like a triangle or rectangle.
Breakouts work because consolidation represents equilibrium between buyers and sellers. When this balance breaks, the side that gains control often pushes price substantially as stops trigger and momentum builds. The move feeds on itself as algorithms and technical traders recognize the breakout and add positions.
Types of Breakouts
Horizontal Breakouts:
Price breaks above resistance or below support that has held multiple times. Classic examples include range breakouts and rectangle pattern completions.
Trend Line Breakouts:
Price breaks above a descending trend line in a downtrend or below an ascending trend line in an uptrend. These often signal trend changes.
Pattern Breakouts:
Completion of chart patterns like triangles, flags, wedges, or head and shoulders. These have measured move targets based on pattern height.
Volatility Breakouts:
Price moves beyond recent volatility ranges, often using Bollinger Bands or ATR-based levels as triggers.
The Anatomy of a High-Probability Breakout
Not all breakouts are equal. The best setups share common characteristics:
Pre-Breakout Consolidation
Quality breakouts emerge from well-defined consolidation:
The longer and tighter the consolidation, the more powerful the subsequent breakout. A 3-month base often produces more explosive moves than a 3-day base.
Volume Confirmation
Volume validates breakouts. The pattern:
Breakouts on low volume often fail. there’s no conviction behind the move. Volume should be at least 150% of average on the breakout bar.
Market Context
Breakouts perform better in certain conditions:
Proximity to Key Levels
The best breakouts occur near decisive levels:
Breakouts from random levels in the middle of ranges have lower probability.
Breakout Trading Strategies
The Classic Breakout Entry
The straightforward approach: enter when price closes beyond the boundary.
Setup:
Stop Loss: Below the breakout bar low (longs) or consolidation zone
Target: Measured move (pattern height) or next resistance level
Example:
Stock consolidates between $50-$55 for 6 weeks. Daily volume averages 1M shares. Breakout day closes at $56 on 2.5M volume. Entry at $56 or pullback to $55. Stop at $53.50. Target $60 (5-point range + $55 breakout).
The Pre-Breakout Entry
For traders who want better risk-reward, enter before the breakout completes.
Setup:
Advantages: Better entry price, tighter stop, higher R-multiple potential
Disadvantages: Lower win rate (sometimes breaks down instead of out), requires earlier conviction
Example:
Triangle pattern with support at $40, resistance declining from $50 to $45. Enter long at $41 with stop at $39. If breakout occurs at $45, you’re already in with 5:1 reward-to-risk vs 3:1 on classic entry.
The Retest Entry
Many breakouts pull back to test the broken level before continuing. This offers lower-risk entry.
Setup:
Advantages: Better entry price, confirmed level holds, lower risk
Disadvantages: Missed move if no retest occurs, sometimes retest becomes reversal
Example:
Forex pair breaks above 1.2000 resistance. Rallies to 1.2050. Pulls back to 1.2005. Forms hammer candle with volume. Entry at 1.2010. Stop at 1.1980. Target 1.2100.
The Volatility Breakout
For markets without clear patterns, use volatility expansion as the signal.
Setup:
Opening Range Breakout:
False Breakout Protection
False breakouts (fakeouts) are the primary risk in breakout trading. Protect yourself:
The 2-Bar Rule
Require two consecutive closes beyond the level before entering. This filters many one-bar fakeouts that immediately reverse.
Trade-off: Later entry, sometimes miss fast moves
Benefit: Significantly higher win rate
Volume Filters
Only trade breakouts with volume at least 150% of the 20-period average. Institutional participation validates the move.
Time-of-Day Filters
Breakouts in final hour often fail as day traders exit. Breakouts in first hour have higher follow-through. Consider time when evaluating breakouts.
Rejection Candle Recognition
If breakout bar shows:
Consider it a potential fakeout and wait for confirmation.
Breakout Pattern-Specific Strategies
Rectangle Breakouts
Price oscillates between parallel horizontal support and resistance.
Entry: Close beyond rectangle boundary
Stop: Inside rectangle (opposite boundary)
Target: Rectangle height projected from breakout point
Best: Rectangles lasting 3+ months on daily charts
Triangle Breakouts
Converging trend lines contain price as volatility contracts.
Ascending Triangle: Flat top, rising bottom → Bullish
Descending Triangle: Flat bottom, declining top → Bearish
Symmetrical Triangle: Converging equally → Directional breakout
Entry: Close beyond triangle boundary
Stop: Inside triangle near apex
Target: Triangle height at widest point projected from breakout
Best: Breakouts in direction of prior trend
Flag and Pennant Breakouts
Brief consolidation after strong directional move (the “pole”).
Flag: Rectangular consolidation against trend
Pennant: Triangular consolidation against trend
Entry: Breakout in direction of pole
Stop: Beyond consolidation pattern
Target: Pole height projected from breakout
Best: Flags/pennants lasting 1-3 weeks on daily charts
Risk Management for Breakout Trading
Position Sizing
Breakout failures are common even with good setups. Size accordingly:
Stop Loss Placement
Several approaches depending on setup:
Conservative: Below the breakout bar low (longs)
Moderate: Inside the consolidation pattern
Aggressive: Below the breakout level
Scaling Out
Breakouts often surge initially then consolidate. Consider:
This captures profit while maintaining participation in big winners.
The Breakout Trader’s Mindset
Accepting Failure Rate
Even excellent breakout traders win only 40-50% of trades. The math works through asymmetry: small losses, large wins. Accept that half your breakouts will fail. The ones that work pay for the ones that don’t.
Avoiding Chasing
The fear of missing out drives traders to enter breakouts after extended moves. By then, the easy gains have occurred and risk-reward has deteriorated. If you miss the breakout, wait for the retest or the next setup. Chasing leads to buying tops and selling bottoms.
Patience for Quality
Not every level that breaks constitutes a trade. Wait for:
Poor breakouts are expensive. Quality breakouts are profitable.
Advanced Breakout Techniques
Multi-Timeframe Confirmation
Require breakout on multiple timeframes:
This layered approach filters many false breaks visible on only one timeframe.
Correlation Breakout Trading
When multiple correlated assets break out simultaneously, conviction increases:
Trade the cleanest breakout while using correlated moves as confirmation.
Failed Breakout Reversals
Sometimes the best trade is fading a failed breakout:
These offer excellent risk-reward (tight stop above failed breakout) but require quick recognition.
Conclusion
Breakout trading captures the explosive moments when market equilibrium shatters. Done well, it offers substantial profits from clear, objective setups. Done poorly, it leads to constant whipsaws and frustration.
Success requires patience for quality setups, discipline in stop loss execution, and acceptance that not all breakouts succeed. The edge comes not from avoiding failed breakouts but from maximizing gains when breakouts work.
Master the patterns. Respect the volume. Honor your stops. And let the breakouts that work pay for the ones that don’t. That’s the breakout trader’s path to profitability.