The Confluence Rule: Why The Same Earnings Beat Made META Lose $158B And GOOGL Gain $130B
Five Mag 7 companies reported earnings this week. Every single one beat estimates. The market sorted them into two completely different outcomes — and the answer was on the chart before earnings landed.
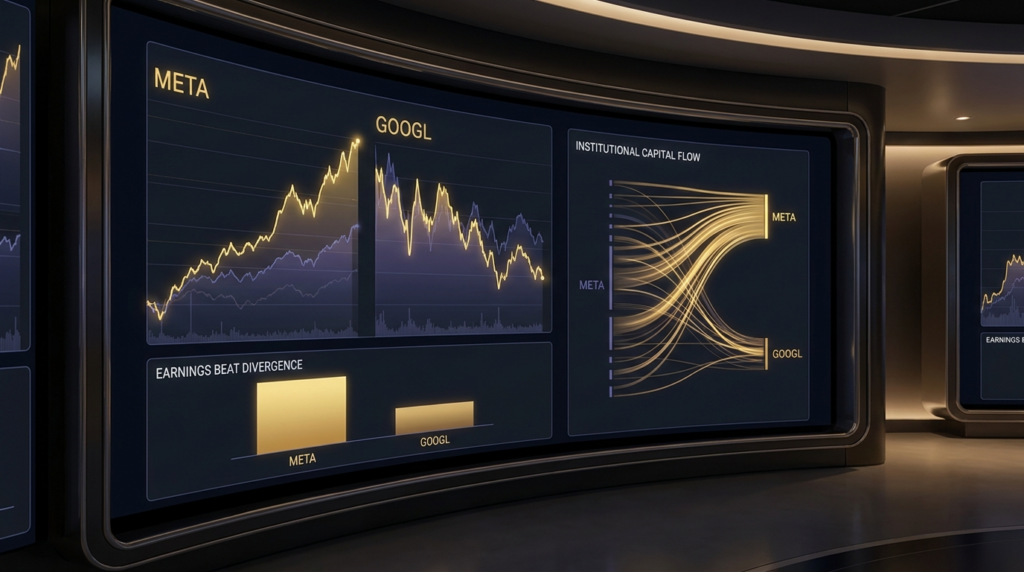
The Week That Made The Point

This past week, five Mag 7 companies stepped up to the earnings podium. META beat by 52 percent and fell 8.55 percent — $158 billion erased on a positive print. AMZN beat by 70 percent and fell 6 percent. MSFT fell nearly 4 percent. NVDA fell in sympathy without even reporting.
Then GOOGL beat by 94 percent and rallied 9.96 percent. AAPL beat its numbers and held clean. Same week. Same Federal Reserve meeting two days before. Same macro backdrop. Five companies, all beating, producing wildly different outcomes.
If you walked into the week with a simple rule that earnings beats equal higher prices, you paid for it. The question is not what the earnings said. The question is what the chart said before earnings landed.
What Confluence Actually Means
Confluence is the intersection of multiple independent technical factors at or near the same price level. Not one indicator flashing a signal. Not a single moving average holding. Multiple unrelated methods pointing at the same level at the same time.
Markets are probabilistic. No single technical tool is reliable on its own. A trend line breaks. A moving average lags. A Fibonacci level gets run through. What changes the probability is when several independent methods, each with its own logic, all point to the same place.
When structural analysis, dynamic analysis, mathematical analysis and momentum analysis all converge, the setup has a different quality. The market tends to react more cleanly because more participants are using more frameworks that land at the same level. Single-factor signals lose this quality entirely. A stock showing momentum without structural support, or momentum without the right price positioning, can look compelling on one screen and fall apart on the next.
The Four Tiers — And Why They Are Not Equal
There are four tiers of confluence and they do not carry equal weight.
Tier One — Structural
These are the levels the market genuinely remembers. Prior highs and lows. Multi-timeframe horizontal zones where price has reversed more than once. Gap fill levels. Round numbers. These levels carry weight because they are visible to every participant regardless of the tools they use. A clean prior high is a prior high on every chart.
Tier Two — Dynamic
These are the levels that move with price. The 20, 50 and 200 exponential moving averages. Rising trend lines. Regression channels. Ichimoku cloud boundaries. Dynamic levels shift as price develops, which means when they align with a structural level from tier one, the coincidence is significant. Two independent methods, one fixed and one adaptive, arriving at the same level at the same time.
Tier Three — Mathematical
Fibonacci retracements at 38.2, 50 and 61.8 percent. Fibonacci extensions at 1.618 and 2.618. Measured moves and AB-equals-CD patterns. These derive purely from ratio and proportion. They have no awareness of the chart’s history or current trend. When a Fibonacci extension target lands on a prior structural high from tier one, and a 50-period moving average from tier two is sitting at the same level, that is three independent methods converging. The probability of a reaction at that level is materially higher than any of the three methods alone.
Tier Four — Momentum
RSI, MACD, stochastic, volume profile. Momentum confirms the reaction. It does not generate the trade on its own. A momentum signal at an isolated level means very little. Inside a Tier 1 to 3 confluence zone, the same momentum reading means the reaction is already underway.
Same Week. Same Beat. Different Stack.
AAPL — Held Clean On Earnings
Tier 1 — Clean structural level beneath price.
Tier 2 — 50-period EMA as direct support.
Tier 3 — Fibonacci extension target at zone.
Tier 4 — Volume profile high confirming level.
All four tiers aligned — paid clean.
META — $158B Moved The Wrong Way
Tier 1 — Structural picture absent.
Tier 2 — Dynamic levels not aligned.
Tier 3 — Mathematical levels pointing elsewhere.
Tier 4 only — single earnings beat reading.
One tier — $158B moved the wrong way.
Same week. Same Federal Reserve. Same broader macro tape. The difference was the stack.
Three Mistakes That Destroy Confluence
Forced Confluence. Selecting only the indicators that agree is confirmation bias, not confluence. The discipline is to read what is actually present, not to keep stacking until the chart says what you already wanted to do.
Indicator Stacking. Four momentum tools producing one factor with four labels is not four independent factors. RSI, MACD, stochastic and momentum oscillator are not independent. They all measure the same thing four different ways.
Single Timeframe. Ignoring the structure on the timeframe above destroys the Tier 1 foundation entirely. A clean Tier 1 to 4 stack on the 15-minute means nothing if the daily timeframe is in a clear downtrend straight through your level.
Building The Zone
Mark structural levels first. Lay the dynamic levels on top. Add the mathematical projections. When two or more land in the same area, the level is real. Wait for momentum to confirm the reaction at that zone — do not pre-empt it. The reaction is what tells you the level held. The reaction is what tells you participants from multiple frameworks all decided this level mattered.
Why It Matters
The $500 billion that shifted across the Mag 7 this week did not shift randomly. It shifted toward stacked confluence and away from single-factor stories. The traders who survive long-term are not the ones with better setups. They are the ones who only take the setups where four independent methods agree, and pass on the ones where only one does.
The earnings calendar is the loudest catalyst in markets. The chart structure is the quietest filter. When they agree, the trade has a different quality. When they disagree, the chart almost always wins.
This is analysis, not financial advice. Trading involves substantial risk. Always manage your risk and trade your own plan.
Get the daily framework intelligence
Trade the framework, not the noise.
The principles in this article are how we read markets every day. Members get the live application: daily Pre-Asia, Pre-London, Pre-NY and Post-Close briefs across 20+ instruments, the indicator suite, the Foundry library, and live community.
Free Explorer tier · No card required · Upgrade when you’re ready
Deepen Your Understanding
Related articles from the Titan Protect Foundry: