Tesla (TSLA) — Daily Framework Read | Sunday 3 May 2026
Tesla (TSLA) | Monday Open Framework Read | Data basis: Friday 1 May 2026 close
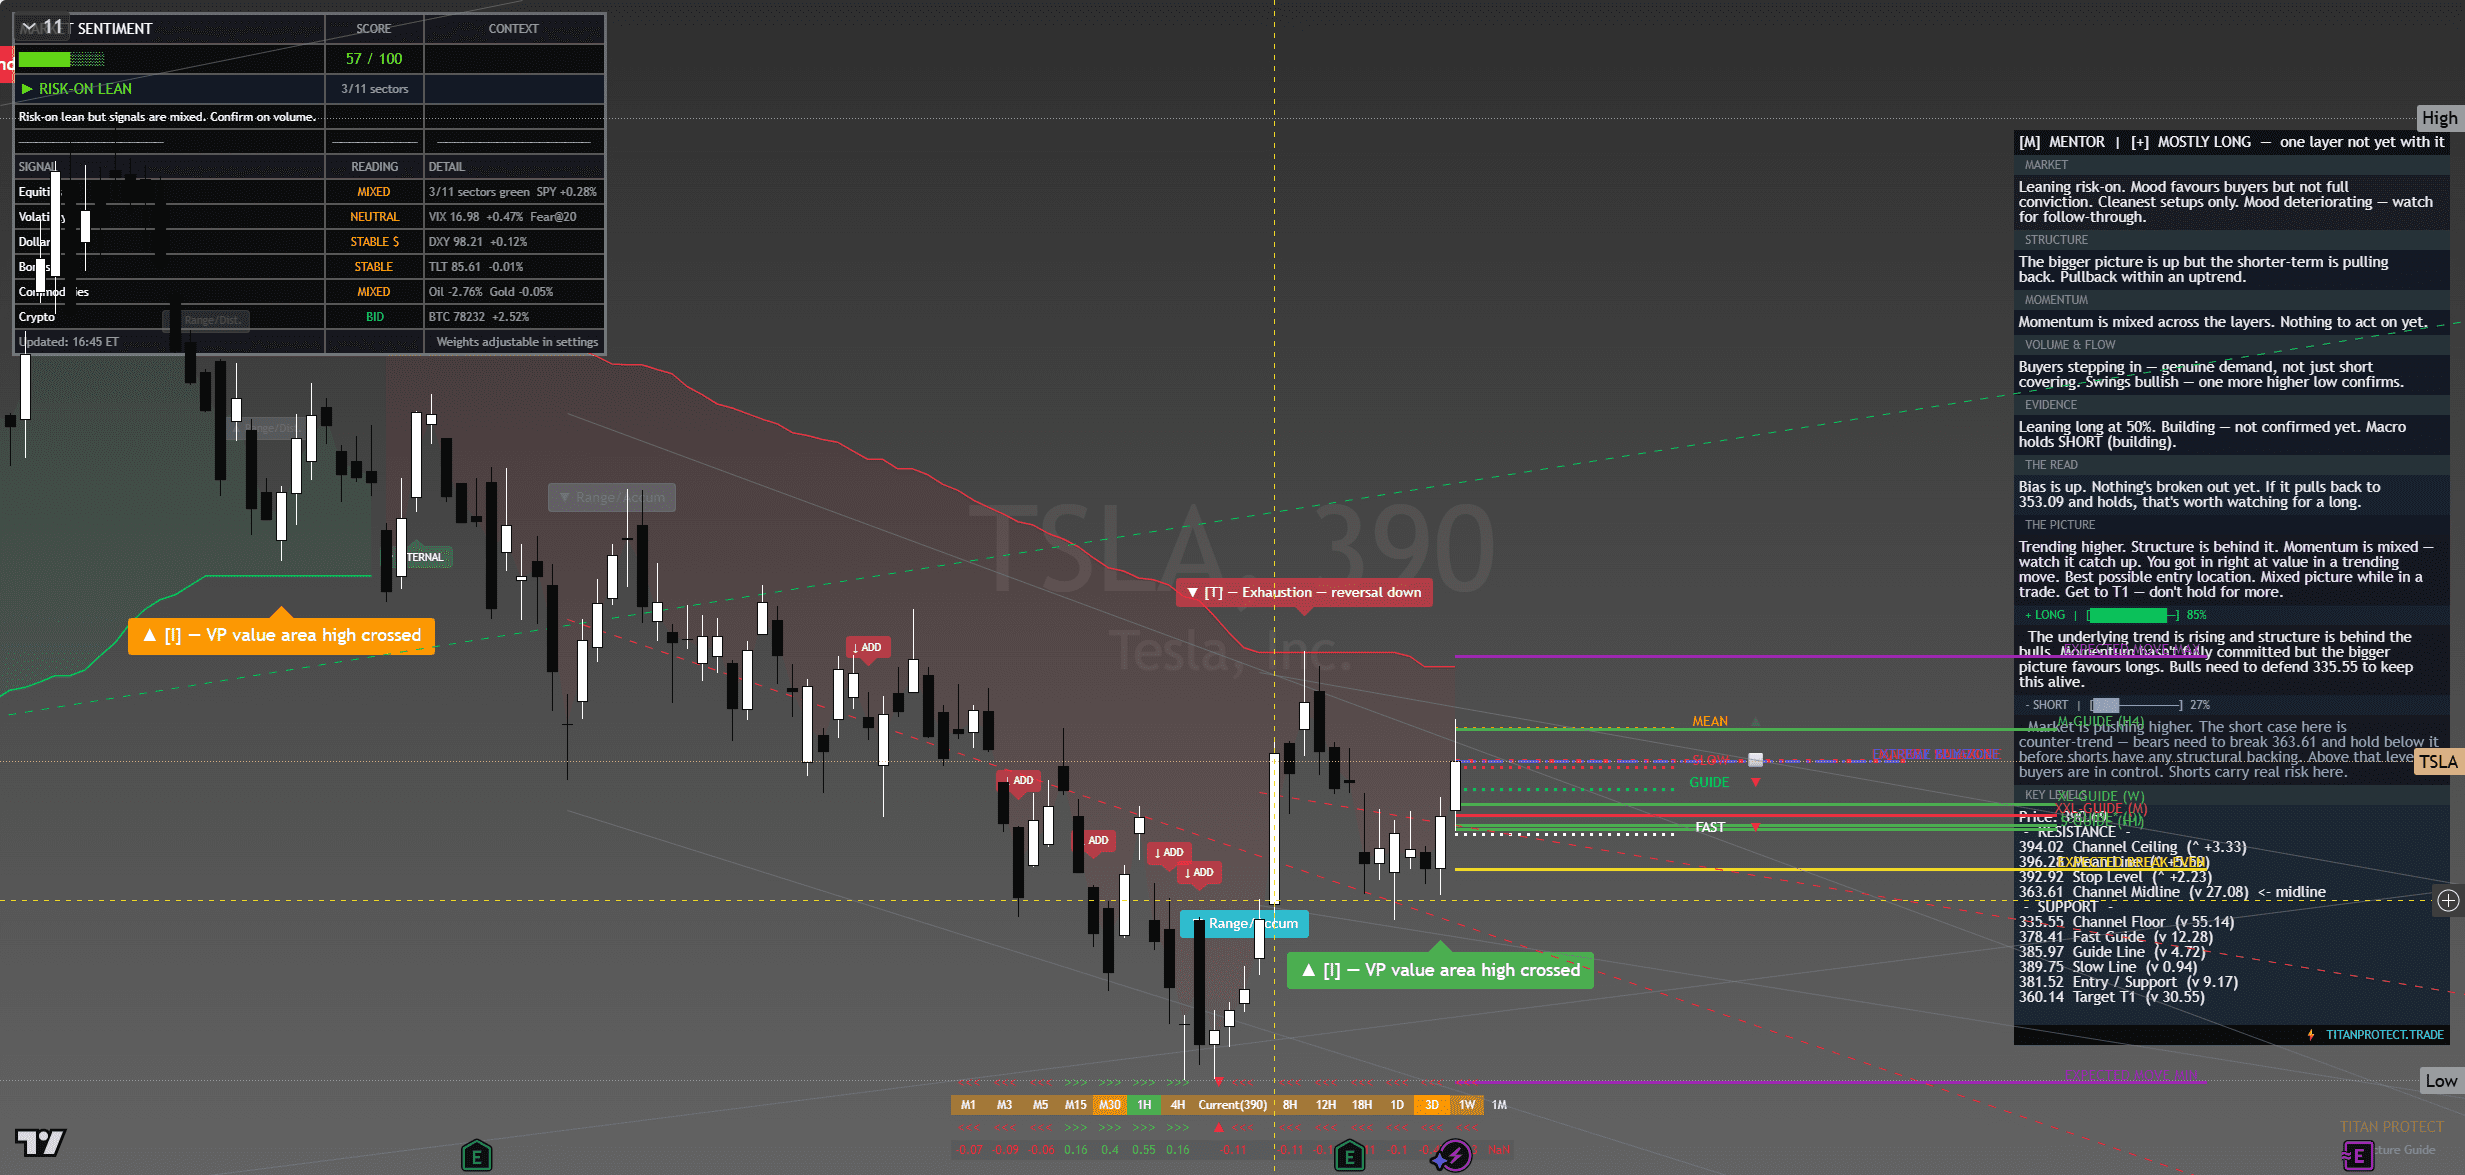
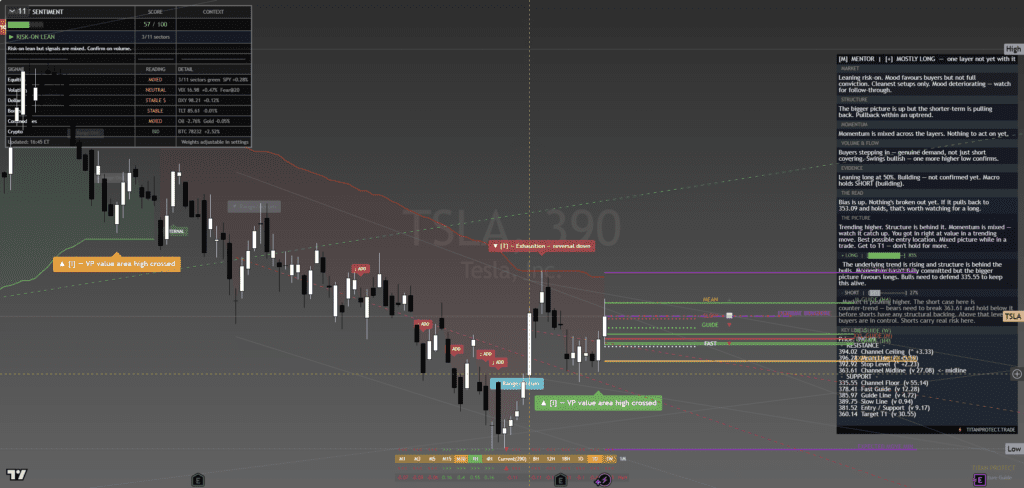
Tesla (TSLA) — chart with framework overlay. The Lens annotations show structural breaks, reversal triggers and confluence zones at the levels referenced below.
Where It Sits
Structure
Structurally TSLA is in a clear uptrend with higher highs and higher lows on daily and 4-hour timeframes. Friday’s close sits in the upper third of the recent range, holding above the rising 20-day MA. The structure is constructive but the volatility profile demands smaller size.
Momentum
Momentum is firm and accelerating on the daily timeframe — that is the signature of a high-beta name catching up to the broader tape. Internal momentum readings sit in the upper half of their range without flagging exhaustion.
Volume & Flow
TSLA volume on Friday’s close was strong, with options flow showing aggressive call buying in the 270-280 strikes. The positioning is bullish with conviction. The flip side is that crowded positioning can reverse fast.
Key Levels
| Level | Type | Significance | Action Zone |
|---|---|---|---|
| 275.00 | Resistance | Round number, recent swing high zone | Take profits if reached |
| 267.00 | Pivot | Friday intraday high cluster | Hold above = bullish bias |
| 262.40 | Friday close | Reference anchor | Bias line for Monday open |
| 256.00 | Support | Recent breakout retest level | Buy zone with defined stop |
| 248.00 | Major support | Prior consolidation floor | Stop-out below for longs |
Three Scenarios Into Monday Open
Continuation
TSLA opens firm, holds 262, takes 267 cleanly on continued risk-on mood and EV narrative. Runs to 275 round number by close. High-beta continuation.
Range
TSLA opens flat, churns 258-270 through the session. Magnet to Friday close. Range trade with high intraday volatility typical of the stock.
Mean Reversion
TSLA fades on demand headlines or competitor news, breaks 256, runs to 248. High-beta give-back possible on any risk-off shift.
Risk Score
Risk sits at Around 65% heading into Monday open.
Risk is elevated. TSLA is the highest-beta name in the major mega-cap complex with daily ranges that routinely exceed 4 percent. The structure is constructive but the stock’s volatility means stops need to be wider and position sizes proportionally smaller. The trade is real but the discipline must be tight.
How to Walk It
Entry / Stop / Target structure:
- Long 256.50-258.00 pullback | Stop 254.00 | Target 267.00 | R:R 3:1
- Long 267.50 breakout | Stop 263.00 | Target 275.00 | R:R 1.7:1
- Short 277+ rejection | Stop 280.00 | Target 268.00 | R:R 3:1
Experience-level guidance:
Beginner: The Monday open after a Friday record close is exactly the situation where over-confidence costs money. Reduce size to half your standard. Trade only the cleanest setup from the entries above. If the tape opens against your bias, do nothing — wait for the second hour, when the institutional flow has tipped its hand.
Intermediate: Use the levels table to define the trading range. Fade the extremes with defined stops, take profits before the round-number resistance levels. Do not carry directional positions through the day if you cannot watch the tape — Monday opens are prone to fast reversals.
Advanced: The vol regime is supportive of trending moves. Defined-risk options structures around the key pivot levels capture the asymmetry cleanly. Keep notional small relative to your book — Monday after a record-close week is asymmetric speculation, not core positioning.
The Sunday Composite — How This Read Sits Inside The Cross-Asset View
This single-instrument framework read is one slice of the larger Sunday weekend synthesis. The composite takes positioning, macro, sentiment, volatility, sector dispersion and trade structure as separate analytical layers and arrives at a unified composite verdict for Monday open. Each layer below is unpacked in full.
Read the full composite for the cross-asset context driving this instrument:
The institutional positioning split — Asset Managers vs Leveraged Funds in size
PCE clearance and the macro case for Monday’s carry
The three-layer sentiment disagreement — surface greed, retail neutral, professionals hedged
The vol curve term structure and what VVIX is signalling
Sector dispersion and the breadth problem behind the record close
The Monday position-management playbook — sizing tiers and trade plans
Sunday Overwatch — the unified composite verdict
Continue Reading
The macro frame driving this read is unpacked in the weekend briefs:
Sunday Setup — Reading The Tape Into Monday Open
PCE Cleared, VIX Crushed, SPY Closed 720 — Friday Post-Close Recap
This analysis is for educational and informational purposes only. It does not constitute financial advice. Always manage your risk independently and in accordance with your own financial circumstances.
Continue with Titan Protect
Twenty-plus instruments. One framework.
We read more than twenty instruments daily across four sessions. The framework’s sunrise call landed across the day — the Pre-NY case study shows what the lines drew, what New York did, and where the read stands.
Core
£59/mo
Indicator suite plus daily framework reads.
Edge Popular
£109/mo
Core plus Shield dashboard and member-only briefs.
Elite
£179/mo
Edge plus weekly 1:1 call and early access to new tools.
Save 15% on annual billing
Want to see the framework in action? Free Explorer tier — no card required.
Join the live community: Discord channel · Shield dashboard
Education, not financial advice. Trade your own analysis.