Tuesday 5 May 2026 · Daily Framework Read · Indices
The Read
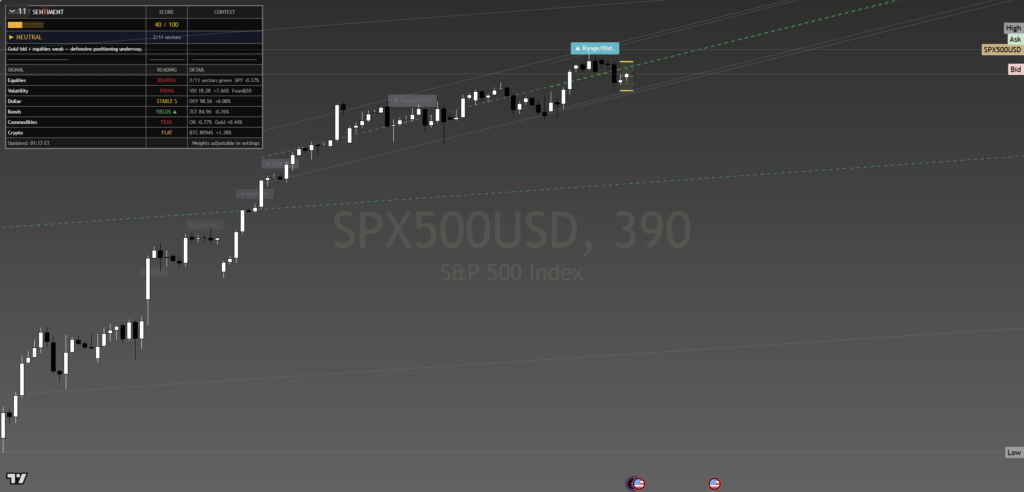
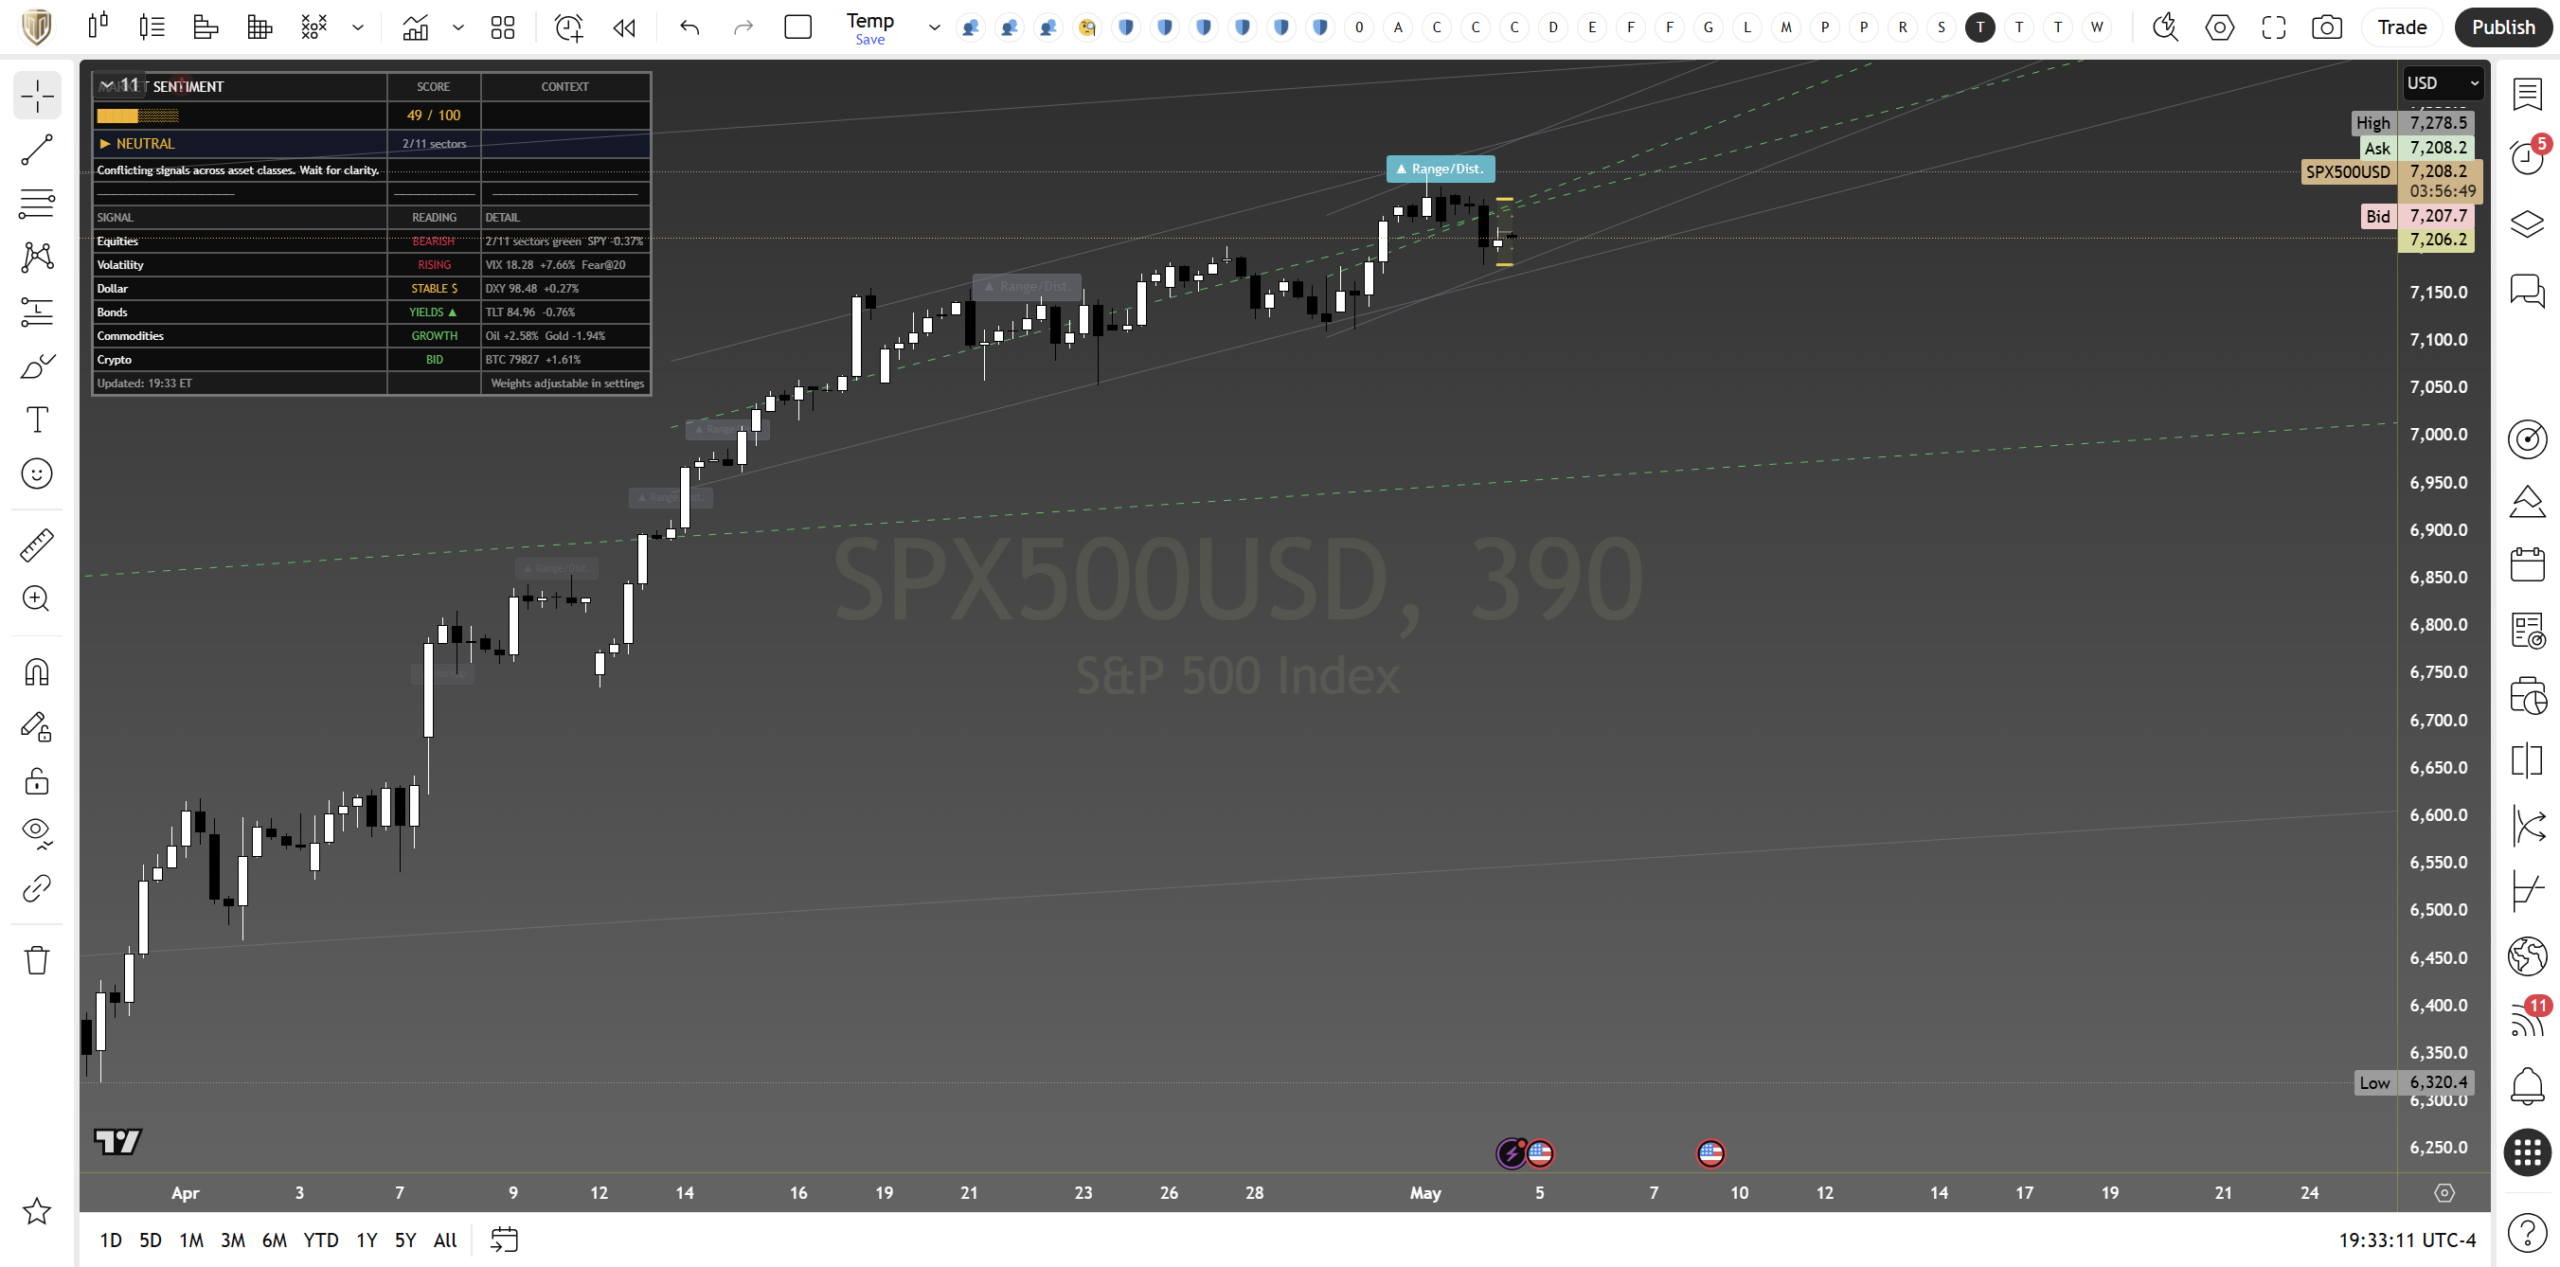
The S&P 500 closed Monday at 7,201, around forty handles below the prior session’s high and a touch above the value area floor. That sounds like nothing on a chart that has rallied a thousand points off the early-April lows, and on the structural read it is nothing. The trend is intact, the higher-low sequence from 6,200 is unbroken, and the diagonal that has carried price since the mid-April reclaim still runs underneath the tape. What has changed is the tone underneath the price.
The framework is doing the same thing it did into the late-April highs. It is asking for confirmation. The cross-asset score has flattened to neutral, equities are reading defensive against a backdrop where futures are green but cash is leaking, and the volatility cohort is no longer collapsing the way it did during the impulse leg. That is not a top call. It is the framework saying the easy money in this trend has been made, and the next leg either earns its size on a clean break or hands the chart back to chop.
The Setup
| Read | Monday 4 May | Tuesday 5 May |
|---|---|---|
| Bias | Long, conviction firm | Watching · long pending hold of value |
| Conviction | Building into highs | Softening at the upper edge |
| Structure | Markup, fresh swing high tagged | Markup paused, distribution candle on the daily |
| Volume & flow | Buyers in control through the close | Flow flattening, sellers defending the highs |
| Cross-asset | Aligned bullish across equities and credit | Mixed · greed reading with vol creeping back |
| Mentor tone | “Aligned for continuation” | “Confirming signals across asset classes. Wait for clarity.” |
Yesterday the framework wanted you long. Today it wants you patient. The same trend is on the screen, the same diagonal is supporting price, and the same higher-low sequence is intact. The difference is that the panel that was firing on every cylinder yesterday has gone quiet. Equities are reading defensive even as futures hold up, the volatility lane has stopped collapsing, and the dollar and bonds are stable rather than confirming risk-on. That is the textbook profile of a trend pausing for breath rather than reversing, but it is also the profile that occasionally tips into a deeper retracement when the wrong catalyst lands.
Levels
| Zone | Level | What It Means |
|---|---|---|
| Upper extension | 7,244 to 7,290 | Friday’s high and the next round-number magnet. Break opens the next leg. |
| Pivot · current | 7,200 to 7,210 | The decision band. Daily close decides whether the pause is constructive or distributive. |
| Trend support | 7,140 to 7,170 | Rising diagonal from the mid-April reclaim. First buy zone on weakness. |
| Step support | 7,050 to 7,080 | Late-April breakout shelf. Real test of the trend if reached. |
| Invalidation | 6,900 to 6,940 | Last higher-low. A daily close below here changes the regime. |
Read the table from the middle outwards. The pivot is the only level that matters this session. Hold it on a daily close and the trend’s bid stays in place, with the upper extension as the natural target on a fresh break. Lose it on a closing basis and the read steps down to the trend support, where buyers either show up at the diagonal or the chart gets a deeper test of the late-April shelf. Below the shelf you are asking the entire reclaim to fail, and that requires a catalyst the panel is not currently flagging.
Scenarios
The Verdict
The S&P 500 is in the textbook pause that follows an impulse. Trend up, structure intact, momentum cooling, cross-asset reads asking for confirmation rather than chasing. The single most important number this session is the daily close relative to the pivot band. Above it the trend earns the next leg. Below it the chart hands itself back to the diagonal for a test, and the framework will reassess from there.
The honest read is that the asymmetry has compressed since Friday. A long entered at the pivot has limited room to the upper extension and meaningful room to the step support if the level fails. That is why the framework has dialled bias from “long with conviction” to “watching with patience”. The trade is still there. It just needs the close to confirm it before it earns size, and there is no edge in front-running that resolution. Risk on this setup reads around 55 percent, balanced between trend support and the absence of a fresh momentum impulse.
Educational analysis only. Not investment advice. Trading carries substantial risk including loss of capital. Past performance is not indicative of future results. Always do your own research.
Continue with Titan Protect
Twenty-plus instruments. One framework.
We read more than twenty instruments daily across four sessions. The framework’s sunrise call landed across the day — the Pre-NY case study shows what the lines drew, what New York did, and where the read stands.
Core
£59/mo
Indicator suite plus daily framework reads.
Edge Popular
£109/mo
Core plus Shield dashboard and member-only briefs.
Elite
£179/mo
Edge plus weekly 1:1 call and early access to new tools.
Save 15% on annual billing
Want to see the framework in action? Free Explorer tier — no card required.
Join the live community: Discord channel · Shield dashboard
Education, not financial advice. Trade your own analysis.