S&P 500 — Daily Framework Read | Sunday 3 May 2026
S&P 500 | Monday Open Framework Read | Data basis: Friday 1 May 2026 close
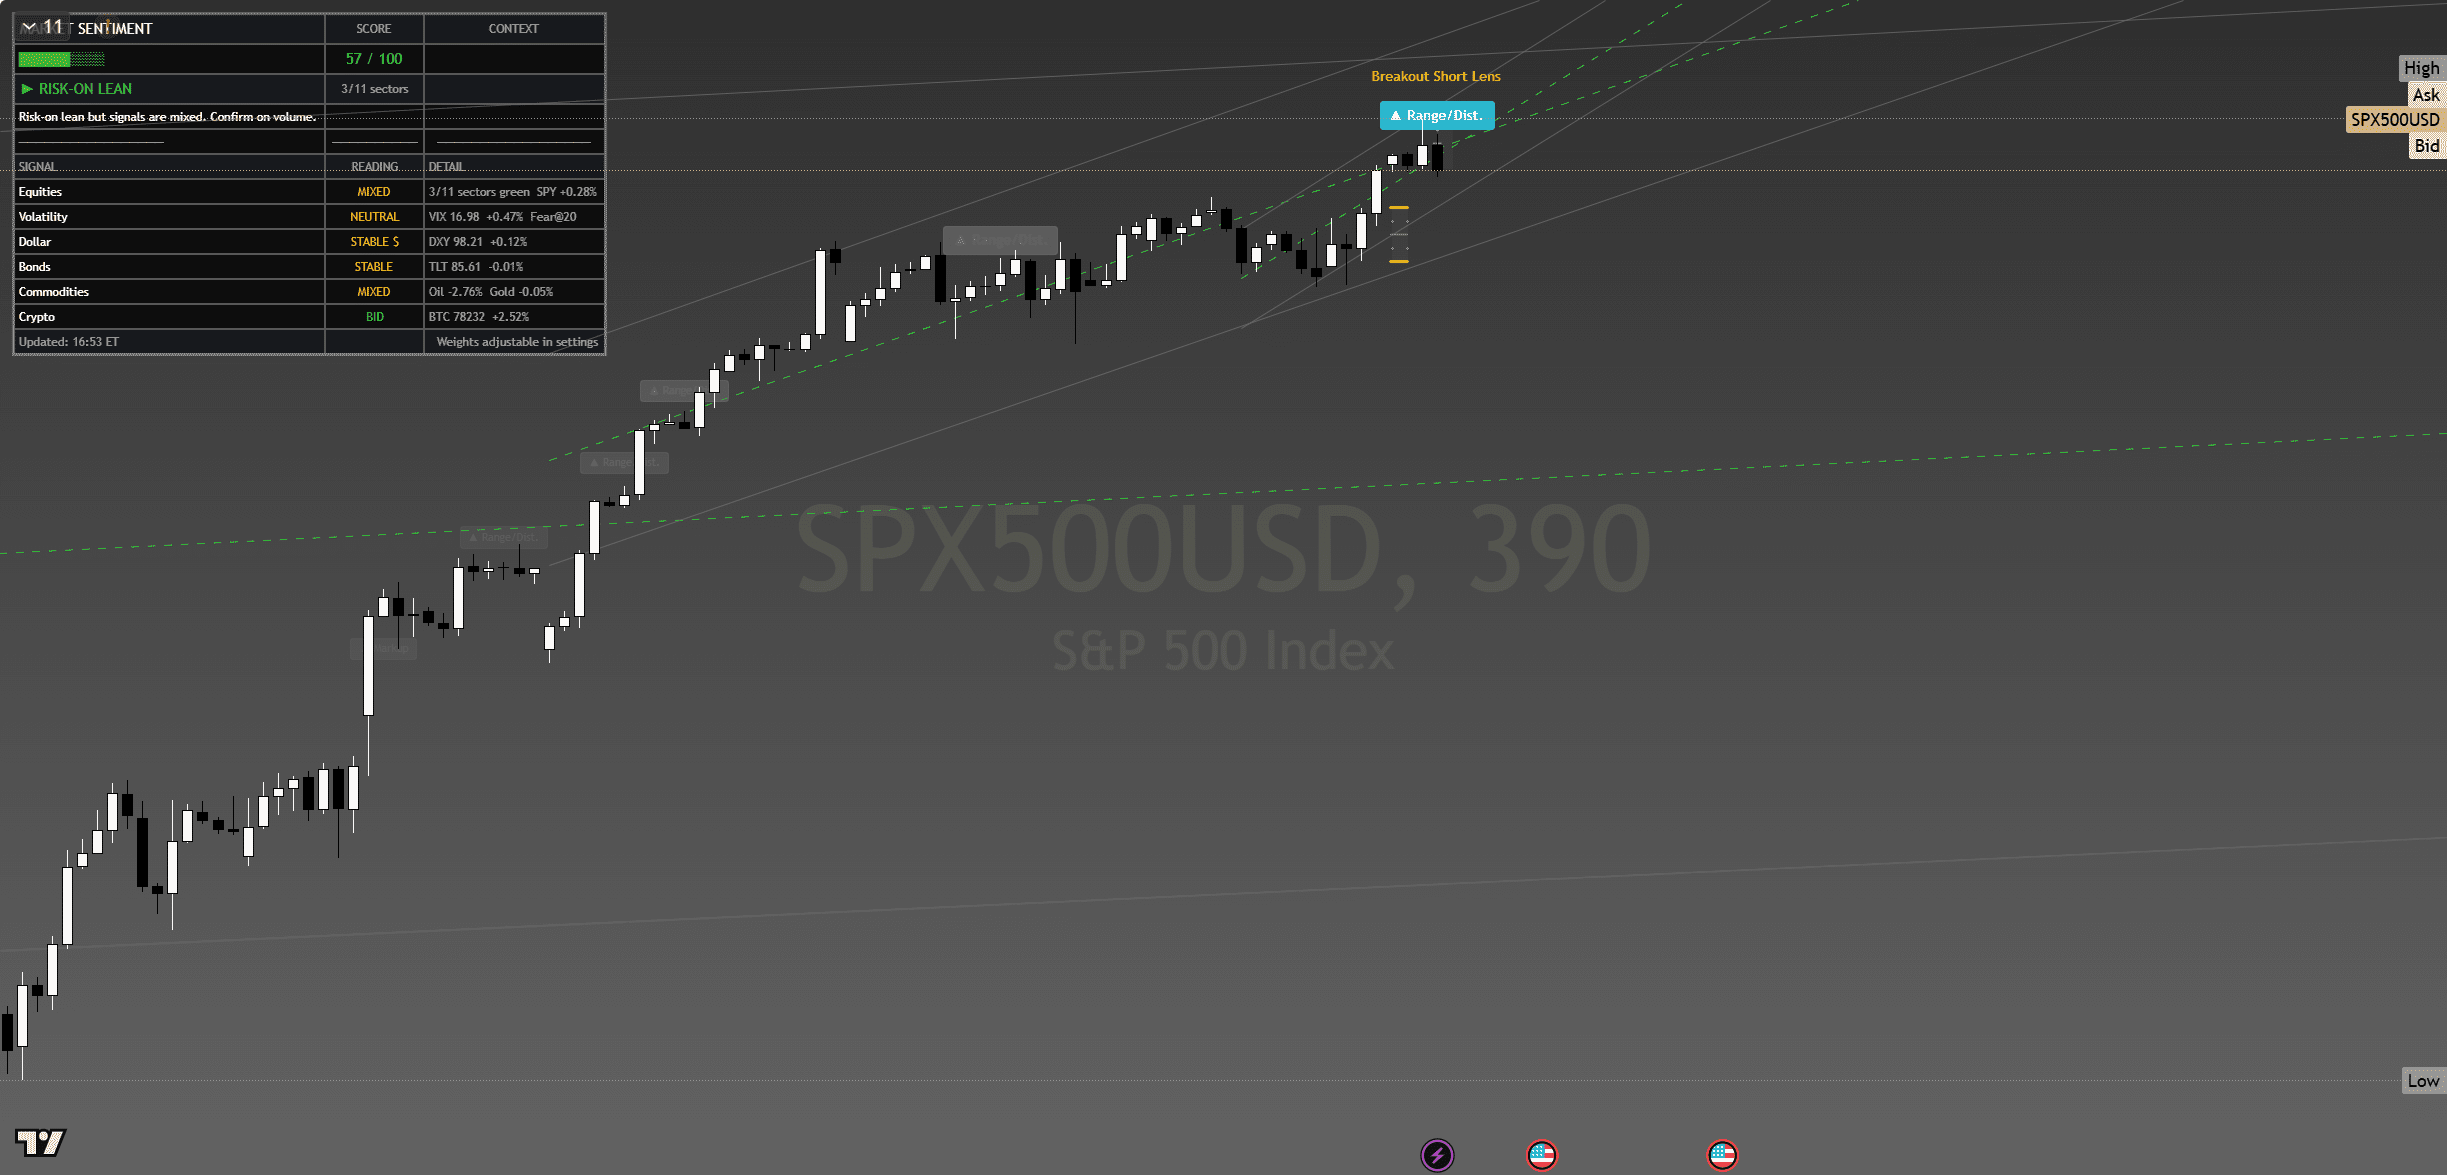
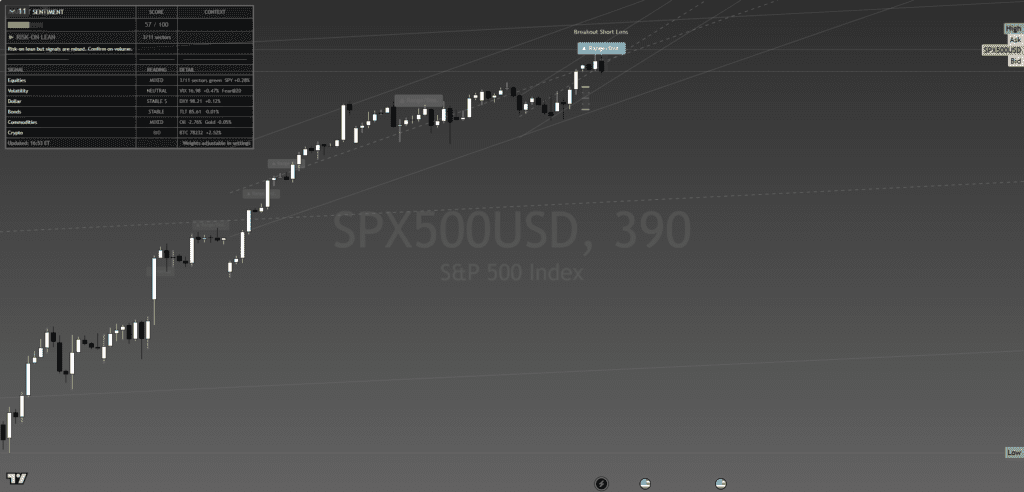
S&P 500 — chart with framework overlay. The Lens annotations show structural breaks, reversal triggers and confluence zones at the levels referenced below.
Where It Sits
Structure
The index sits at all-time highs with the structural trend firmly up across daily, 4-hour, and 60-minute timeframes. Friday’s close above the 7,200 round number on declining VIX is the kind of confirmation that historically extends. The structure is healthier than the Nasdaq’s because participation is broader — financials, industrials, and consumer discretionary all contributed to Friday’s print.
Momentum
Momentum is constructive but not extended. The pace of the advance over the past two weeks has been orderly with no parabolic finish. Internal momentum readings sit in the upper half of their range without pressing extremes — that is the kind of momentum profile that supports continuation rather than reversal.
Volume & Flow
Volume on Friday’s close was solid and broad. Breadth confirmed the move with the advance/decline line printing fresh highs. That is the structural difference between this index and the Nasdaq — when participation is broad, the next leg up does not need a single name to lead. Monday’s tape should reflect that breadth quality unless something interrupts the mood.
Key Levels
| Level | Type | Significance | Action Zone |
|---|---|---|---|
| 7,290 | Resistance | Round-number stretch target, sparse historical reference | Take profits if reached |
| 7,250 | Pivot | Friday intraday high zone — Monday gap-up trigger | Hold above = continuation; reject = fade |
| 7,230 | Friday close | Reference anchor for Monday open | Above = bias up; below = mean revert |
| 7,200 | Support | Round number, recent breakout retest | Buy zone with defined stop |
| 7,150 | Major support | Pre-PCE consolidation floor | Stop-out below for longs |
Three Scenarios Into Monday Open
Continuation
Index opens flat-to-firm, takes out Friday’s intraday high cleanly, runs to 7,260 by midday. SPY 720 holds as the magnetic level, vol bleeds further into the mid-16s. Continuation works because the macro overhang has cleared and there is no catalyst to interrupt the drift higher.
Range
Index opens flat, churns 7,210-7,250 through the session waiting for ISM Services Tuesday. Magnet to Friday close. Range trade — small size, defined stops, take what the tape gives.
Mean Reversion
Index gaps open above 7,250, runs into the 7,260 zone and meets supply, fades back below 7,200 by close. Failed-breakout pattern. Not the base case unless VIX flips back above 17.5 intraday.
Risk Score
Risk sits at Around 50% heading into Monday open.
Risk is moderate. The macro overhang has cleared, vol is compressed, and the trend is clearly up. The constraint is that the index is at a record high and the easy continuation trade is already in place — anyone chasing strength on Monday is buying after the move has already happened. Standard sizing on existing longs, smaller new entries, hard stops.
How to Walk It
Entry / Stop / Target structure:
- Long 7,210-7,220 pullback | Stop 7,180 | Target 7,260 | R:R 2:1
- Long 7,255 breakout | Stop 7,225 | Target 7,290 | R:R 1.2:1
- Fade 7,275+ rejection | Stop 7,295 | Target 7,225 | R:R 2.5:1
Experience-level guidance:
Beginner: The Monday open after a Friday record close is exactly the situation where over-confidence costs money. Reduce size to half your standard. Trade only the cleanest setup from the entries above. If the tape opens against your bias, do nothing — wait for the second hour, when the institutional flow has tipped its hand.
Intermediate: Use the levels table to define the trading range. Fade the extremes with defined stops, take profits before the round-number resistance levels. Do not carry directional positions through the day if you cannot watch the tape — Monday opens are prone to fast reversals.
Advanced: The vol regime is supportive of trending moves. Defined-risk options structures around the key pivot levels capture the asymmetry cleanly. Keep notional small relative to your book — Monday after a record-close week is asymmetric speculation, not core positioning.
The Sunday Composite — How This Read Sits Inside The Cross-Asset View
This single-instrument framework read is one slice of the larger Sunday weekend synthesis. The composite takes positioning, macro, sentiment, volatility, sector dispersion and trade structure as separate analytical layers and arrives at a unified composite verdict for Monday open. Each layer below is unpacked in full.
Read the full composite for the cross-asset context driving this instrument:
The institutional positioning split — Asset Managers vs Leveraged Funds in size
PCE clearance and the macro case for Monday’s carry
The three-layer sentiment disagreement — surface greed, retail neutral, professionals hedged
The vol curve term structure and what VVIX is signalling
Sector dispersion and the breadth problem behind the record close
The Monday position-management playbook — sizing tiers and trade plans
Sunday Overwatch — the unified composite verdict
Continue Reading
The macro frame driving this read is unpacked in the weekend briefs:
Sunday Setup — Reading The Tape Into Monday Open
PCE Cleared, VIX Crushed, SPY Closed 720 — Friday Post-Close Recap
This analysis is for educational and informational purposes only. It does not constitute financial advice. Always manage your risk independently and in accordance with your own financial circumstances.