Risk Management: The 1% Rule
SL/TP Intelligence Series — 2/10
🔍 The Myth of the Perfect Ratio
Ask any trader about risk-to-reward ratios, and you’ll hear the same mantra: “You need at least 1:2. Risk $1 to make $2.”
It’s repeated so often it sounds like gospel. But here’s the problem: It’s incomplete at best, dangerous at worst.
A 1:2 ratio with a 30% win rate loses money. A 1:1 ratio with a 60% win rate makes money hand over fist. The ratio alone tells you nothing.
❌ The Real Equation
What matters isn’t the ratio on any single trade. What matters is this:
(Win Rate × Average Win) − (Loss Rate × Average Loss) = Expectancy
This is your edge. This is what separates profitable traders from the broke masses.
Let’s break it down:
Example 1: The 1:2 Dream
- Win rate: 35%
- Average win: $200
- Average loss: $100
- Expectancy: (0.35 × $200) − (0.65 × $100) = $70 − $65 = $5 per trade
Barely profitable. One bad streak wipes you out.
Example 2: The “Poor” 1:1 Reality
- Win rate: 55%
- Average win: $100
- Average loss: $100
- Expectancy: (0.55 × $100) − (0.45 × $100) = $55 − $45 = $10 per trade
Double the profitability of the “better” ratio.
Example 3: The Professional’s Edge
- Win rate: 45%
- Average win: $150
- Average loss: $100
- Expectancy: (0.45 × $150) − (0.55 × $100) = $67.50 − $55 = $12.50 per trade
Sustainable, scalable, profitable.
✅ Why Win Rate and Ratio Are Linked
Here’s what nobody tells you: Your win rate and your risk-to-reward ratio are connected.
When you demand a 1:3 ratio, you’re asking the market to move three times further in your favor than against you. That requires:
- Stronger trends
- Better timing
- More patience
- And yes, fewer winning trades
When you accept a 1:1 ratio, you’re asking for equal movement. Easier to achieve. More frequent wins. But each win only covers one loss.
There’s no free lunch. You don’t get high win rates and high ratios. You choose your trade-off.
🧠 Finding Your Personal Edge
Different strategies have different natural ratios:
| Strategy Type | Natural Ratio | Win Rate | Expectancy Driver |
|————–|—————|———-|——————-|
| Trend Following | 1:3 to 1:5 | 30-40% | Big winners pay for many small losses |
| Mean Reversion | 1:1 to 1:1.5 | 55-65% | Consistent small wins compound |
| Breakout Trading | 1:2 to 1:3 | 40-50% | Momentum drives extended moves |
| Scalping | 1:0.5 to 1:1 | 60-70% | High frequency, small edges |
The mistake: Using a trend-following ratio with a mean-reversion strategy. Or demanding scalping win rates with breakout patience.
💡 The Confluence Principle
At Titanprotect, we teach confluence — multiple factors aligning to increase probability. The same applies to risk-to-reward:
Don’t pick targets arbitrarily. Let the market structure show you where price is likely to go.
Your target should be:
1. At the next significant level (support, resistance, prior high/low)
2. Achievable based on current volatility (not fantasy)
3. Aligned with your strategy’s natural edge (trend, reversal, etc.)
When you let the market determine your target (just like you let it determine your stop), the ratio becomes a result, not a requirement.
⚠️ The Breakeven Fallacy
“I moved my stop to breakeven, so now it’s a free trade.”
Famous last words.
Moving to breakeven feels smart. You can’t lose money. But consider:
- You entered based on analysis
- Price moved in your favor (validation)
- You moved stop to entry (removing validation room)
- Price retraces to your entry (perfectly normal)
- You’re stopped out at breakeven
- Price continues to your original target (without you)
You were right about the trade. Your risk management made you wrong.
The professional doesn’t move to breakeven to feel safe. They move to breakeven when the market structure supports it — when a new support level has formed, when the thesis has evolved, when the risk profile has genuinely changed.
📝 Dynamic Risk Management
Static ratios assume every trade is the same. They’re not. Market conditions change:
High Volatility Periods
- Wider stops required (more noise)
- Targets may need adjustment (bigger moves possible)
- Position size should decrease (same dollar risk, less exposure)
- Ratio might naturally widen (1:3 becomes achievable)
Low Volatility Periods
- Tighter stops possible (cleaner moves)
- Targets should be realistic (momentum limited)
- Position size can increase (same dollar risk, more exposure)
- Ratio might naturally tighten (1:1.5 is realistic)
The professional adapts. The amateur forces the same ratio on every trade.
🎯 Calculating Your True Ratio
Most traders calculate risk-to-reward before entering. Professionals calculate it after a series of trades:
1. Track 50 trades with your strategy
2. Calculate actual average win (not target, actual)
3. Calculate actual average loss (not stop distance, actual)
4. Calculate actual win rate (not hope, reality)
5. Derive your true ratio from results
Then ask: Is this sustainable? Can I survive the losing streaks? Does this match my psychological profile?
🔧 The Psychology of Targets
Here’s where it gets personal. Your risk-to-reward preference reveals your psychology:
The 1:3 Trader:
- Patient
- Comfortable being wrong often
- Can handle strings of losses
- Believes in “the big one”
- Risk: Giving back profits waiting for home runs
The 1:1 Trader:
- Wants consistency
- Uncomfortable with large drawdowns
- Values steady account growth
- Prefers frequent validation
- Risk: Missing major moves, overtrading
The 1:5 Trader:
- Extreme patience
- Very selective
- Can handle long periods of nothing
- Believes in perfection
- Risk: Too few trades, analysis paralysis
Neither is wrong. But you must match your ratio to your personality. A 1:3 trader trying to take 1:1 profits will sabotage themselves. A 1:1 trader holding for 1:3 will give back gains.
📊 Practical Application
For your next 10 trades, try this:
1. Set your stop at your invalidation point (market structure)
2. Set your target at the next significant level (market structure)
3. Calculate the ratio — whatever it is
4. Adjust position size to match your dollar risk tolerance
5. Let the trade play out — no moving stops or targets
6. Record everything — entry, stop, target, exit, result
After 10 trades, calculate:
- Win rate
- Average win
- Average loss
- Expectancy
This is your true ratio. This is your edge (or lack thereof).
💰 The Bottom Line
Risk-to-reward isn’t a number you choose. It’s a result of:
- Your strategy’s natural win rate
- Market conditions and volatility
- Your psychological profile
- Your ability to let winners run and cut losers
Stop obsessing over the perfect ratio. Start obsessing over positive expectancy.Dynamic vs. Static Stops: When to adjust (and when it’s fatal)
- Volatility-Based Position Sizing: The missing piece
- Profit Target Strategies: Taking money off the table
- The Psychology of Letting Winners Run: Why it’s so hard
The best ratio is the one that matches your strategy, your psychology, and current market conditions — not the one you read in a book.
Trade smart. Protect your capital.
— The Titanprotect Team
📝 Action Items
- [ ] Review your last 20 trades and calculate your average R-multiple
- [ ] Identify which trades had poor risk-to-reward and why
- [ ] Set a hard rule: No trade under 2:1 risk-to-reward ratio
Next in series: Why Your Stop Loss Keeps Getting Hit →
Word Count: ~1314 words
Reading Time: 6 minutes
Level: Beginner-Friendly
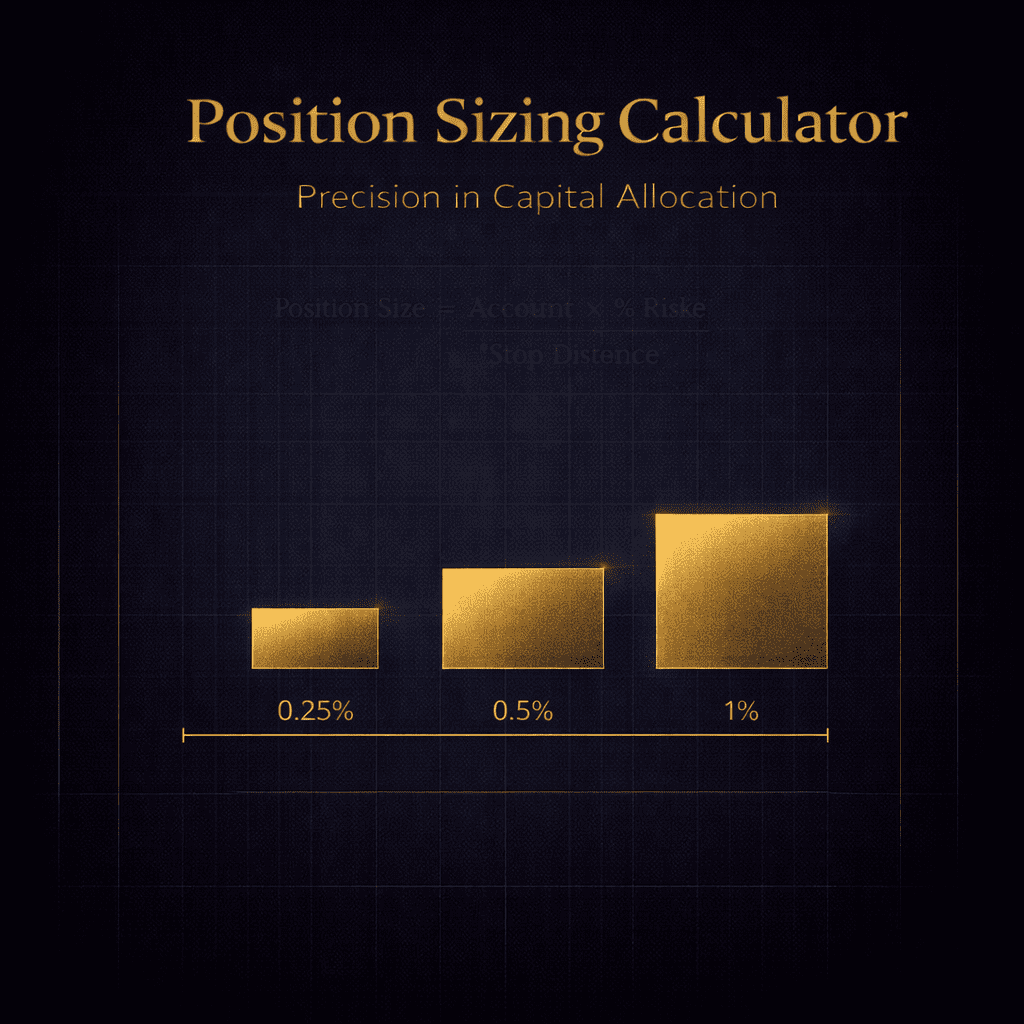
🎯 Try Our Position Calculator
Calculate your optimal position size, risk/reward ratio, and portfolio heat in seconds.