Predictive Edge Series
Predictive Edge 06: Multi-Timeframe Analysis
The higher chart does not care about your entry chart. It sets the context for every move you see below it. Understanding that hierarchy is where edge lives.
The Higher Chart Always Wins
Every timeframe exists within the context of the timeframe above it. A bullish setup on a five-minute chart during a confirmed downtrend on the daily is not a buy signal. It is a counter-trend trade being attempted within a larger directional bias that is against you. That setup may work occasionally. It will not work consistently, and when it fails, it tends to fail with momentum because the larger participants are positioned against you.
This is the foundational principle of multi-timeframe analysis: the higher chart defines the field, and the lower chart provides the entry point within that field. You do not override the higher chart with what you see on the lower one. You use the lower chart to find the best timing within the direction and structure that the higher chart has already defined.
Most retail traders do the opposite. They find a setup on the timeframe they are most comfortable watching, execute it, and then check the higher timeframe as an afterthought. If the higher timeframe confirms, they feel validated. If it contradicts, they sometimes rationalise the trade anyway. This backwards workflow is one of the most consistent generators of avoidable losses in retail trading. The higher timeframe check is the first step, not the last.
The Three-Timeframe Approach
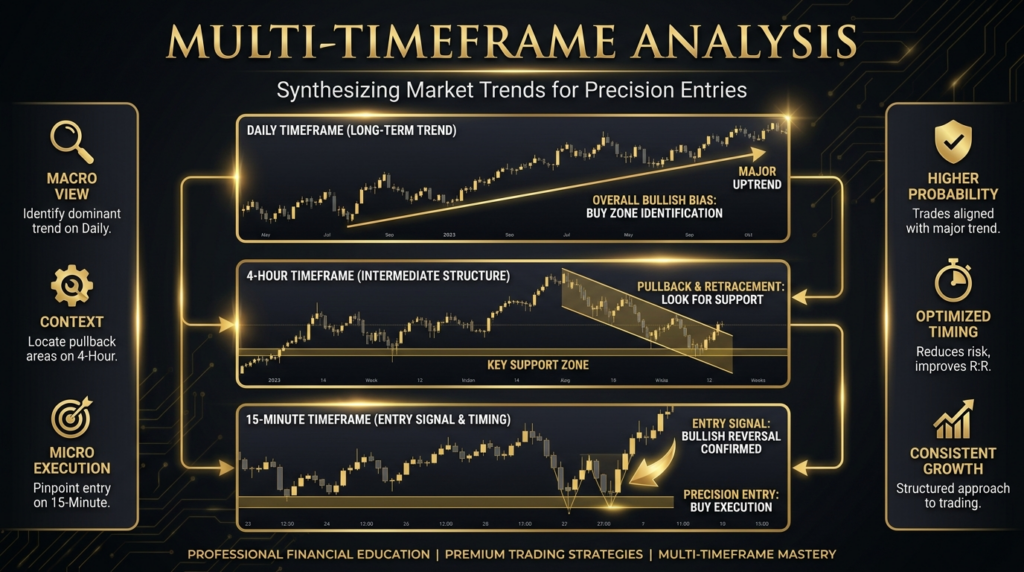
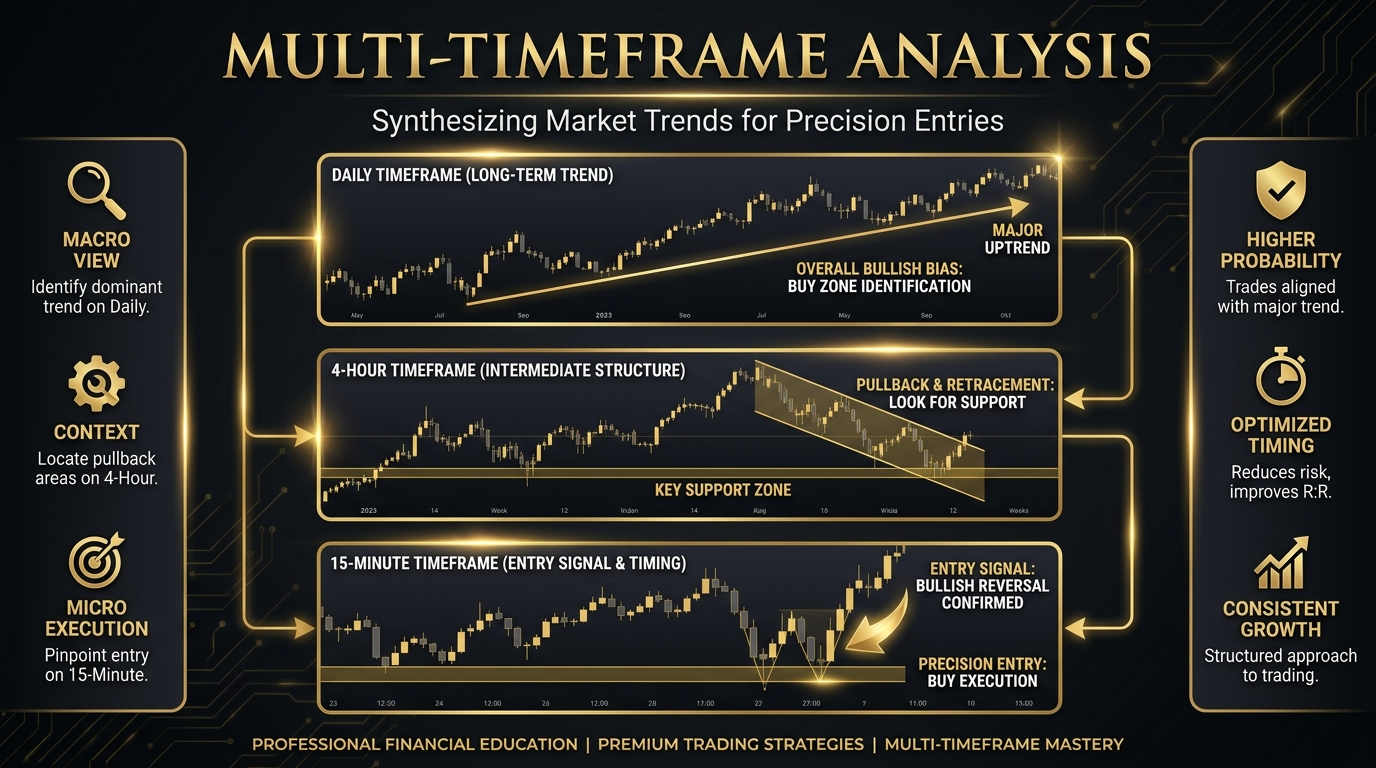
The practical framework is three timeframes: a macro chart for directional context, an intermediate chart for setup identification, and an entry chart for timing. The exact timeframes depend on your trading style, but the ratios between them matter more than the specific values. Each timeframe should be four to six times the duration of the one below it to ensure the views are genuinely independent rather than variations on the same picture.
The macro chart is read first. What is the current structural state? Is price in an uptrend, a downtrend, or a range? What are the key levels that participants on this timeframe are watching? Is price approaching or respecting any of those levels? This chart sets the filter for what kinds of trades are valid. If the macro chart is in a downtrend, you are looking for short setups on the intermediate and entry charts. Long setups against a macro downtrend require structural justification that overrides the bias, which is a rare and specific condition.
The intermediate chart is where setup identification happens. Having established the macro direction, you zoom in to find the structure of the current move within that direction. Is the intermediate chart in a pullback within the macro trend? Is there a key level on the intermediate chart that aligns with the macro structure? Is the setup forming in the right zone, at a confluence of the macro and intermediate structural arguments?
The entry chart provides the timing. You have the direction from the macro chart and the setup from the intermediate. Now you zoom in further to find the specific moment where the entry is most precise. A rejection candle at the confluence zone on the entry chart, with the momentum aligning with the macro direction, is the full setup. Three timeframes telling the same story simultaneously.
Alignment vs Conflict
Timeframe alignment is when multiple timeframes agree on direction and the structural case for a trade. This produces the highest-probability setups available. The macro chart is trending up. The intermediate chart has pulled back to support. The entry chart is showing the first signs of buying pressure at that support. Every layer is telling the same story. The position is backed by the directional bias of the largest participants visible on the macro chart, sized using the precision of the entry chart.
Timeframe conflict is when different timeframes produce contradictory signals. The macro chart is bearish. The intermediate chart has bounced off a support level and looks locally bullish. The entry chart is showing a buy setup. This is not an alignment. It is a battle between two opposing structural arguments. The macro chart will generally win in the long run because it reflects the positioning of larger, longer-duration participants whose decisions dominate price behaviour.
When timeframes conflict, the correct action is usually to wait rather than to pick a side. Waiting costs nothing. The conflict will resolve when one of the timeframes changes state. The macro chart either continues its downtrend and the intermediate bounce fails, or the macro chart begins to show reversal signs that align with the intermediate bounce. Either resolution produces a clearer setup than the current conflict does.
Why Multi-Timeframe Confluence is the Highest-Edge Setup
A setup where a single timeframe is in your favour is a setup supported by the participants operating on that timeframe. A setup where three timeframes are aligned is supported by three distinct groups of participants simultaneously. The weekly chart participants are positioned in your direction. The daily chart participants are positioned in your direction. The hourly chart is providing the entry timing within that aligned structure. The probability of a move following through is higher because a broader coalition of market participants needs to be wrong for the trade to fail.
This is why multi-timeframe alignment is the highest-edge condition in the confluence framework described earlier in this series. It adds a fourth layer to the three-signal minimum: structural alignment on multiple timeframes is a signal in its own right, generated by a genuinely independent process from price action, momentum, and volume. When all four are present simultaneously, the setup is as strong as the market is likely to offer.
These setups are also rarer than single-timeframe setups. The market is not always in a state where all timeframes are aligned. That scarcity is part of what makes them valuable. A trader who waits for full multi-timeframe alignment before entering will take fewer trades than a trader who enters on every setup on a single timeframe. But the quality of each trade will be materially higher, and the cumulative performance will reflect that quality difference.
The Practical Workflow
Start your session analysis on the highest timeframe you use. Look at the weekly or daily chart first. Mark the key structural levels. Identify the current trend state. Note any major events approaching, earnings, macro data, or technically significant levels that participants on this timeframe will be watching. This takes five to ten minutes and provides the entire framework for the session.
Move to your intermediate chart. Within the macro structure you have identified, what is the current intermediate setup? Is the market in a pullback? Is it near a key intermediate level that aligns with the macro structure? Is momentum on the intermediate chart beginning to show signs of alignment with the macro direction? Mark your key intermediate levels and note the current setup type.
Only then move to your entry chart. Your job on the entry chart is not to find a new setup. It is to find the optimal entry point for the setup already identified on the intermediate chart, within the context already established by the macro chart. You are refining timing, not generating a new thesis. If the entry chart is showing you something that contradicts the intermediate and macro analysis, that contradiction is a reason not to enter, not a reason to reconsider the higher-timeframe view.
| Trading Style | Macro Chart | Setup Chart | Entry Chart |
|---|---|---|---|
| Scalper | 15-minute | 5-minute | 1-minute |
| Intraday | 1-hour or 4-hour | 15-minute | 5-minute |
| Day trader | Daily | 1-hour or 4-hour | 15-minute |
| Swing trader | Weekly | Daily | 4-hour |
| Position trader | Monthly | Weekly | Daily |
| Multi-style / adaptive | Daily as anchor | 4-hour for context | 1-hour or 15-min |
Action Items
- Define your three timeframes now and write them down. Macro, setup, entry. Use the ratios in the table above. Commit to a specific set and use the same three consistently for at least two months before evaluating whether to change them.
- Add a mandatory higher-timeframe check to the start of every session. Before looking at your entry chart, spend five minutes on the macro chart. Write down the trend state and the key structural levels. Start no session without this step completed.
- Review the last five losing trades. For each one, check what the macro chart was doing at the time of entry. Were you trading against it? If yes, that conflict was the primary reason for the loss, and the solution is structural, not tactical.
- For the next week, only enter trades where all three of your timeframes are aligned in direction. Note how many setups this eliminates and whether the trades you do take perform better than your average.
- Identify one instrument where the weekly, daily, and four-hour chart are currently all in the same directional state. Mark the highest-quality entry-level setup visible on that instrument right now. That is the quality standard you are aiming to replicate consistently.
Continue Learning
- Predictive Edge 01: Confluence
- Predictive Edge 02: Price Action
- Predictive Edge 03: Support and Resistance
- Predictive Edge 04: Trend Analysis
- Predictive Edge 05: Momentum