Daily Framework Read | Tuesday 22 April 2026 | Nikkei 225 (JP225)
21:00 London (BST) / 16:00 New York (EDT) / 05:00 Tokyo (JST)
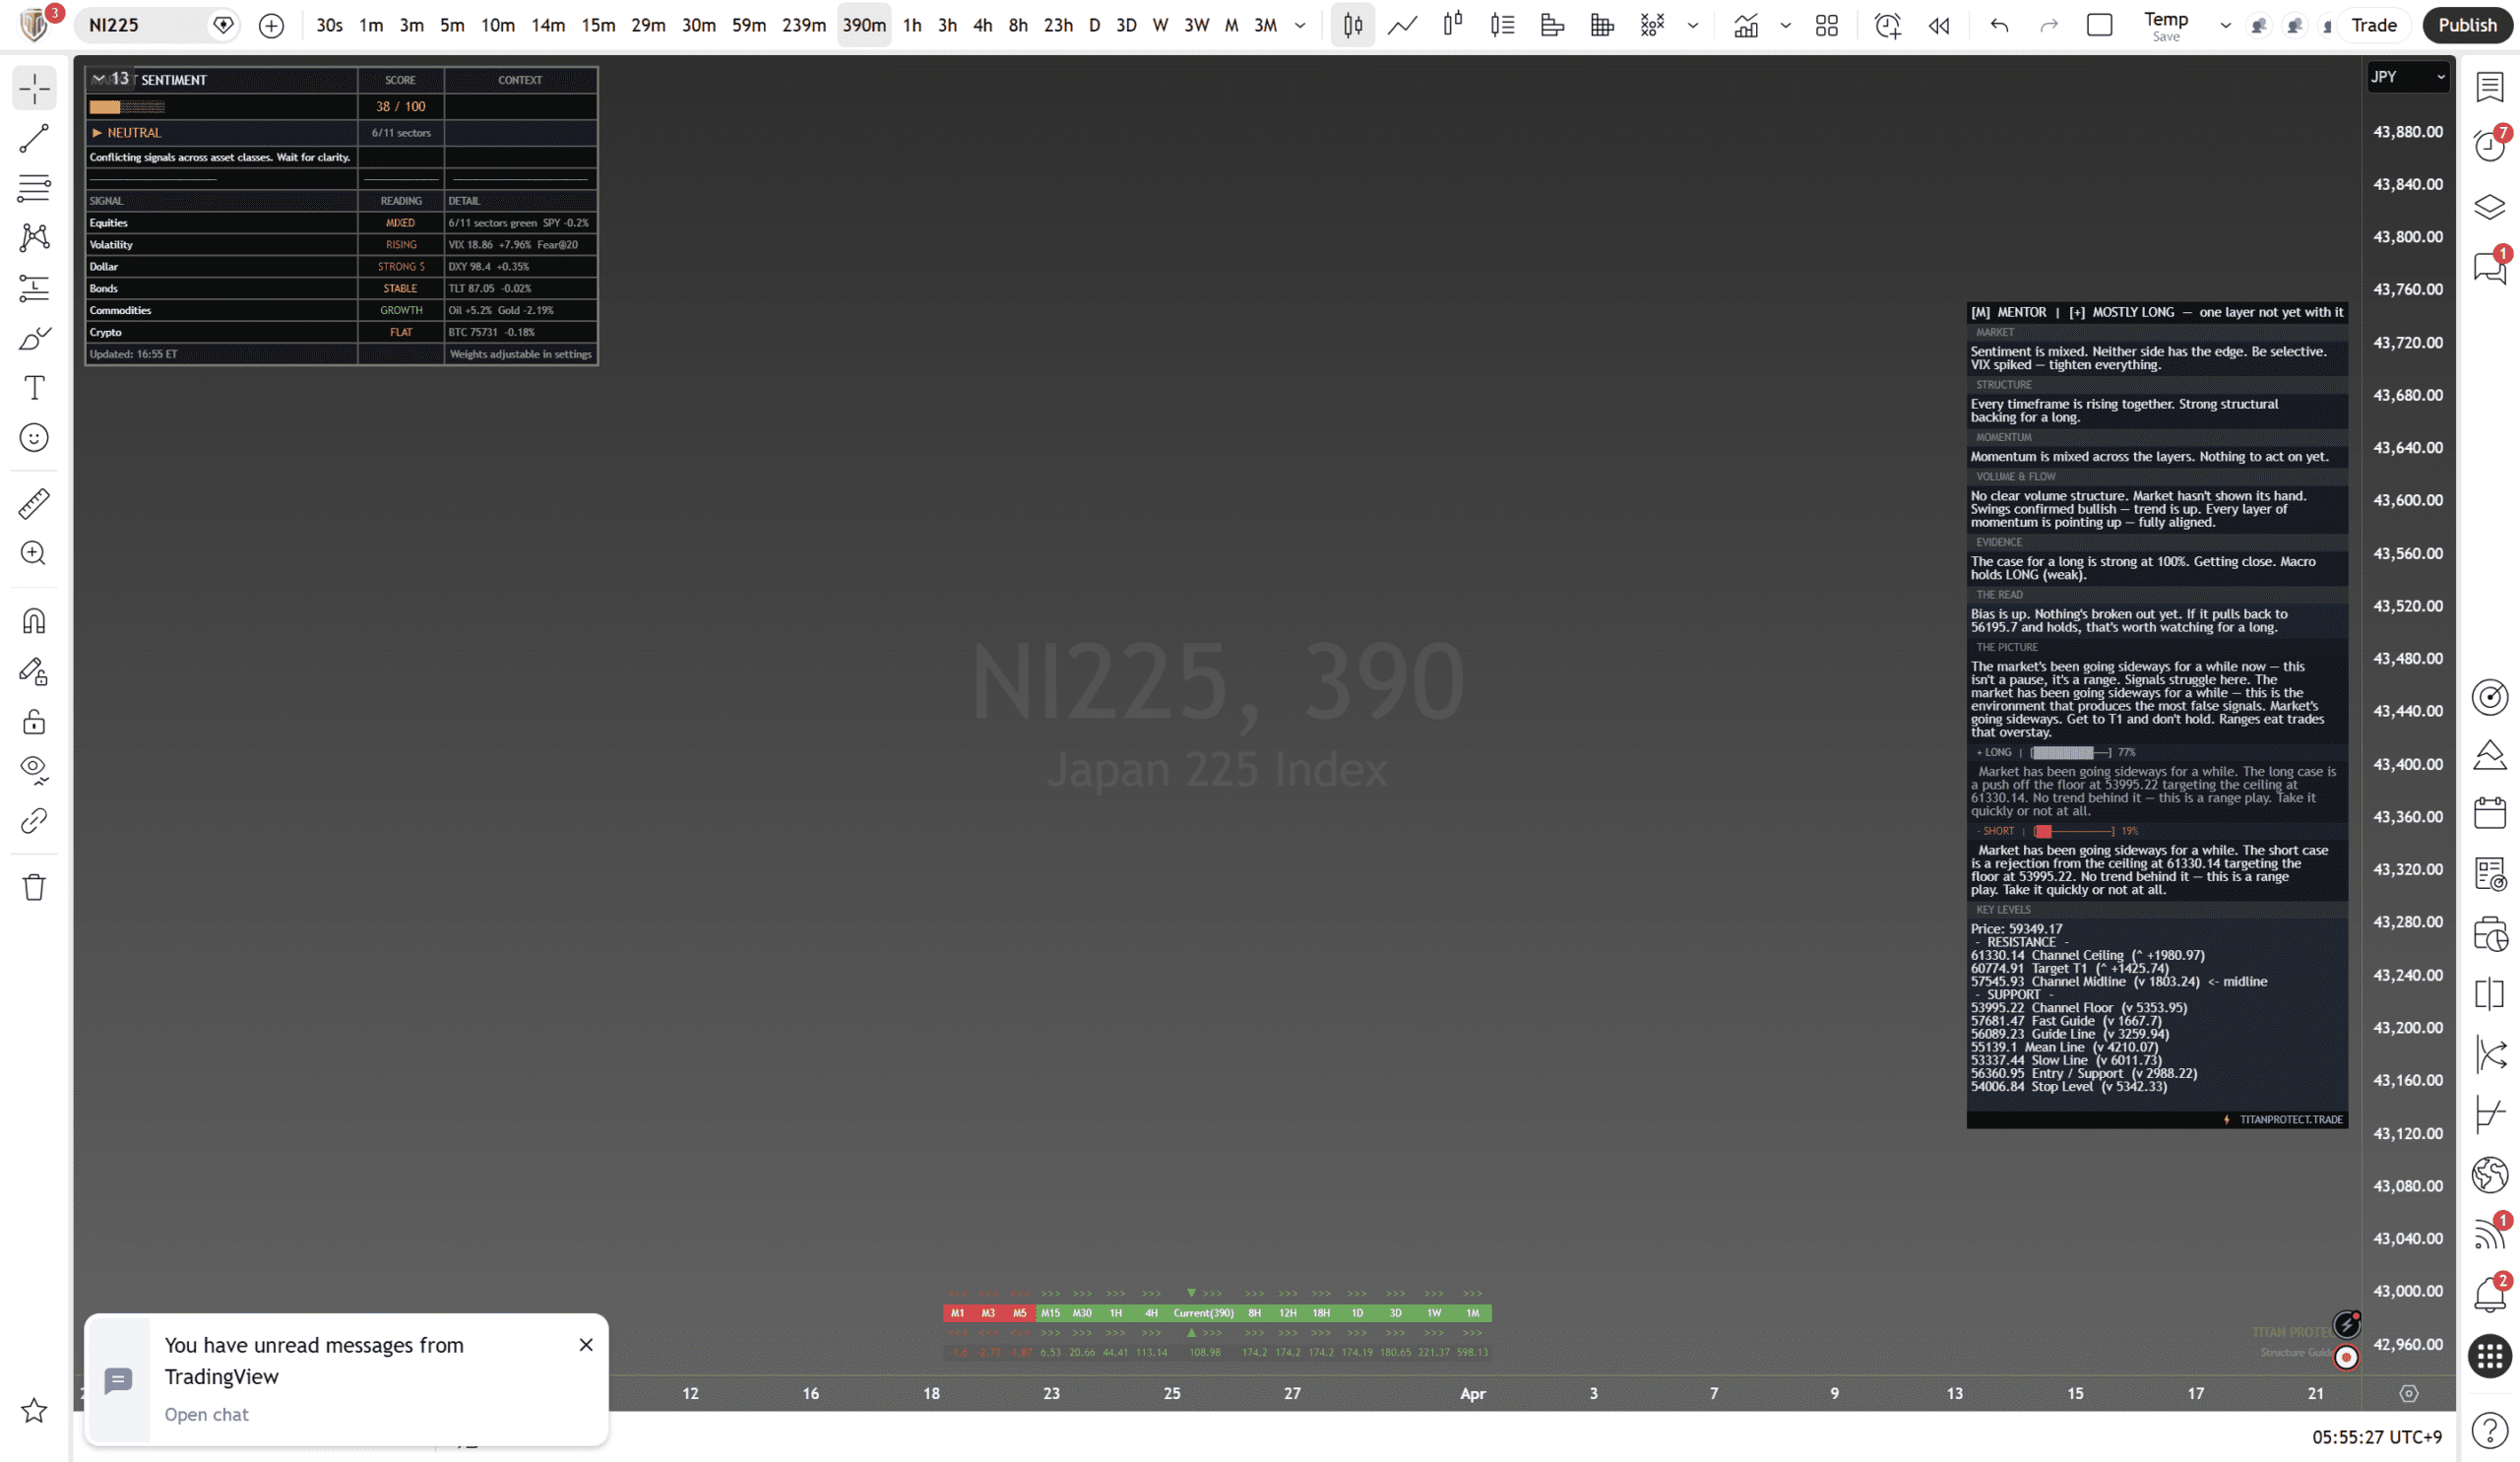
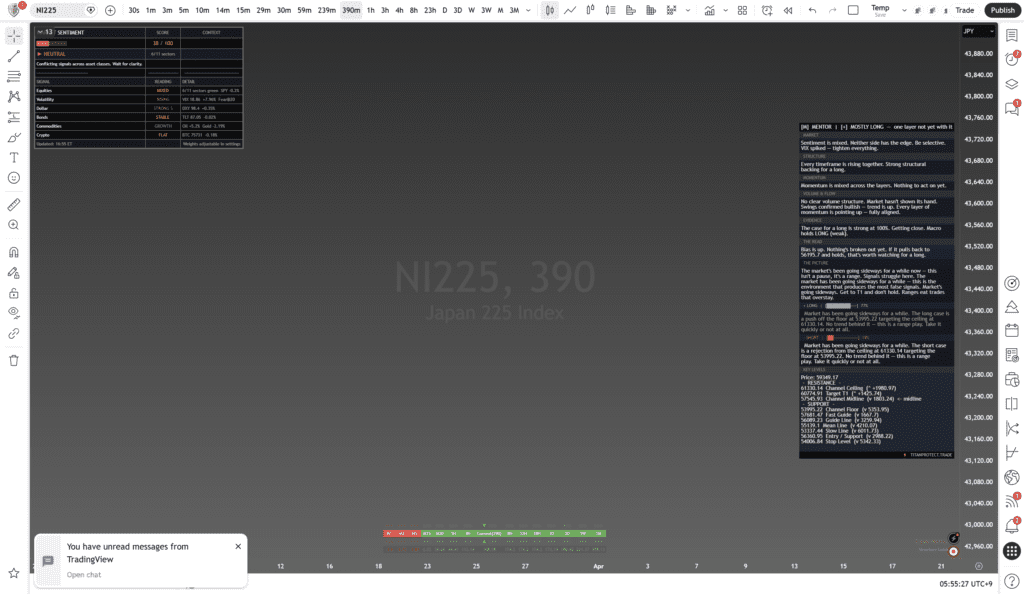
Signal
MOSTLY LONG
Conviction
Around 75%
Risk Level
Around 25% — every timeframe rising together, strong structural backing
Structure
Every timeframe is rising together. Strong structural backing for a long.
Market Context
Sentiment is mixed. Neither side has the edge. Be selective. VIX spiked — tighten everything. The Nikkei stands out from the US selling — structural strength is holding despite global risk-off conditions. 6 of 11 sectors mixed versus the US at only 2 green.
What the Framework Says
Structure
Every timeframe is rising together. Strong structural backing for a long. This is the cleanest structural read of the five indices tonight. When every layer agrees, you pay attention. The trend centre is pulling price higher and the channel structure supports continuation.
Momentum
Momentum is mixed across the layers. Nothing to act on yet. The case for a long is strong at 100% structural alignment. Getting close. Macro holds LONG (weak). Every layer of momentum is pointing up and fully aligned. That is rare across any instrument — it means the path of least resistance is higher.
Volume and Flow
No clear volume structure. Market has not shown its hand. Swings confirmed bullish — trend is up. Every layer of momentum is pointing up — fully aligned. The volume has not confirmed yet, which is the one missing piece. Structure says long. Momentum says long. Volume needs to catch up.
The Cases
Bull Case
LONG at 75%. The long case is a push off the floor at 53,995.22 targeting the ceiling at 61,330.14. No trend behind it — this is a range play. Take it quickly or not at all. Bias is up. Nothing has broken out yet. If it pulls back to 56,195.7 and holds, that is worth watching for a long.
Bear Case
The short case is a rejection from the ceiling at 61,330.14 targeting the floor at 53,995.22. No trend behind it — this is a range play. Take it quickly or not at all. Market has been going sideways for a while — false signals are more common in this environment.
Key Levels
| Level | Price | Distance |
|---|---|---|
| Channel Ceiling | 61,330.14 | +4,380.97 |
| Target T1 | 60,774.91 | +3,825.74 |
| Channel Midline | 57,545.93 | +596.76 |
| Channel Floor | 53,995.22 | -2,953.95 |
| Fast Guide | 57,601.47 | +652.3 |
| Guide Line | 56,089.23 | -859.94 |
| Mean Line | 55,191.1 | -1,758.07 |
| Slow Line | 53,337.44 | -3,611.73 |
| Entry / Support | 54,060.95 | -2,888.22 |
| Stop Level | 54,606.84 | -2,342.33 |
The Call
Framework Bias: LONG
Bias is long but no clean entry yet. The structural alignment is the strongest of all five indices. If price pulls back to 56,195.7 and holds, that is the level to watch. Range conditions mean get to T1 and do not hold. Do not overstay. The market has been going sideways and this is the environment that produces the most false signals.
This is a framework read based on structural, momentum, and volume analysis at the close of 21 April 2026. It is not financial advice. Every trader is responsible for their own risk management. Past framework reads do not guarantee future accuracy. Position sizing and stop placement are your responsibility.
Published by Titan Protect | Daily Framework Reads are available to members 24 hours before public release.