Nasdaq 100 — Daily Framework Read | Sunday 3 May 2026
Nasdaq 100 | Monday Open Framework Read | Data basis: Friday 1 May 2026 close
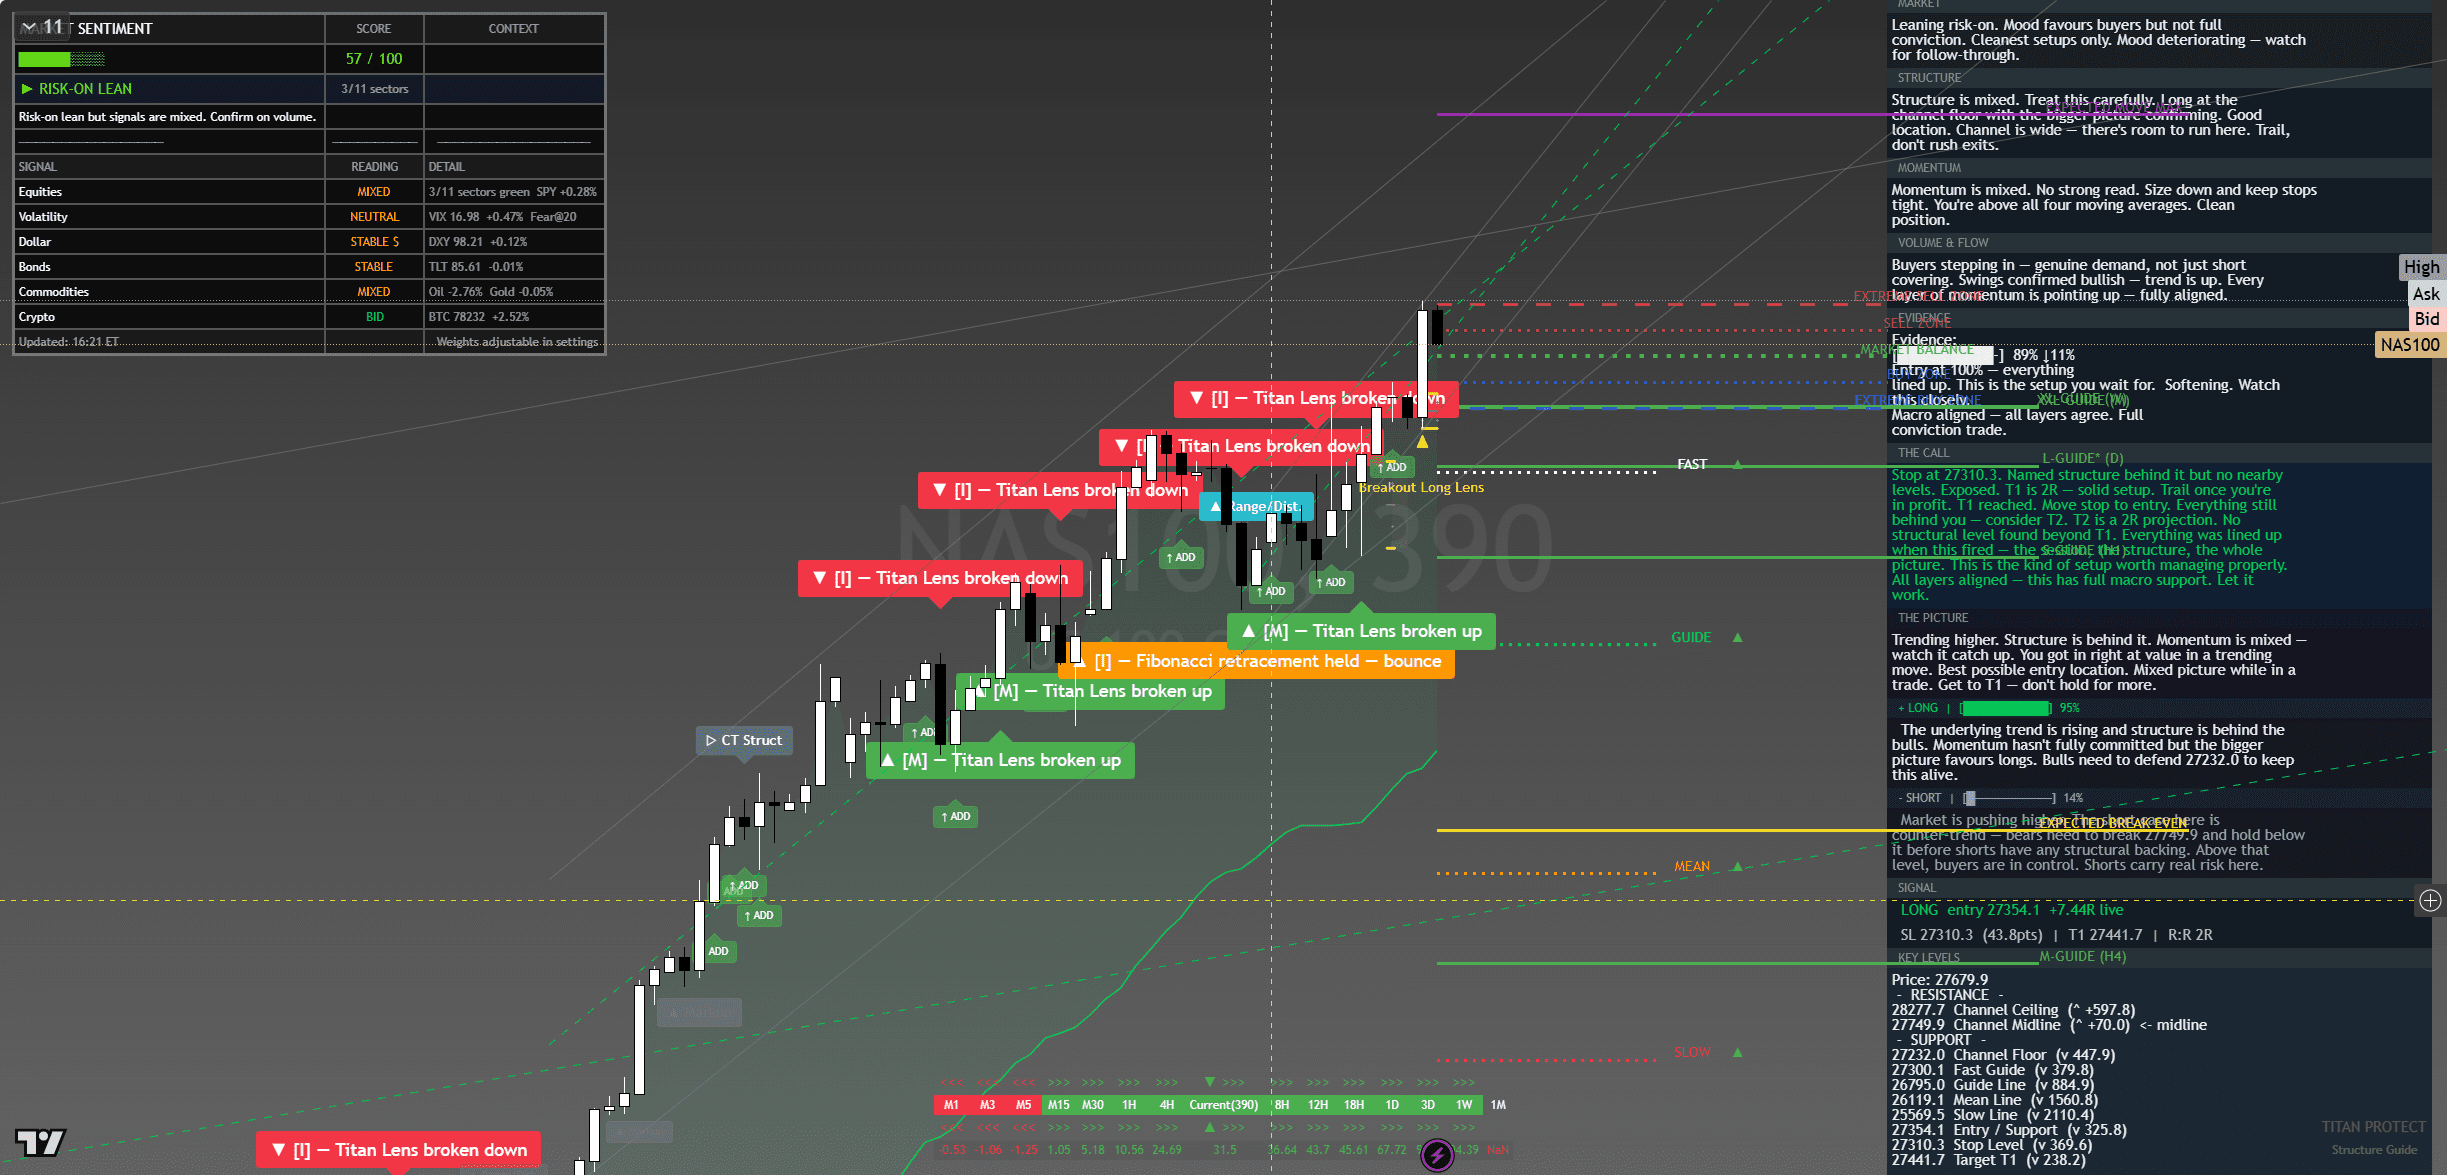
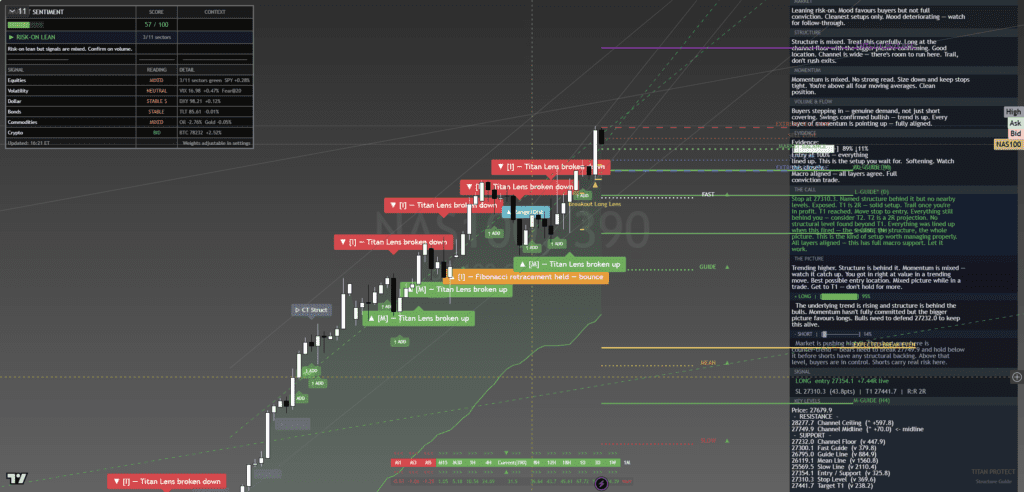
Nasdaq 100 — chart with framework overlay. The Lens annotations show structural breaks, reversal triggers and confluence zones at the levels referenced below.
Where It Sits
Structure
Structurally the index sits above all its short-term moving averages, with the daily trend firmly higher and the 4-hour timeframe printing higher highs and higher lows since the late-April recovery. The breakout from the 27,400 consolidation has held cleanly and price has not retested the level. That is a healthy structural posture for continuation but it also means the asymmetric trade is no longer entry — it is management of an existing long.
Momentum
Momentum is firm but not extended. Friday’s session printed a new high on respectable volume but did not stretch the range — the kind of orderly advance that tends to carry rather than reverse. The internal momentum readings are constructive without flagging exhaustion. The risk is not that momentum fails on Monday, but that it stalls at 28,000 and the round number triggers profit-taking that creates a high-volume reversal candle.
Volume & Flow
Volume on Friday’s close was solid but not standout, with NVDA, MSFT, AAPL doing the heavy lifting. Breadth is the concern — fewer than half of the index constituents made new highs on Friday despite the headline print. When breadth thins on a record close, the next leg up needs broader participation to hold. Watch for a session where 60 percent or more of names trade green to confirm broader participation re-engaging.
Key Levels
| Level | Type | Significance | Action Zone |
|---|---|---|---|
| 28,000 | Resistance | Round-number target zone, prior congestion ceiling | Take profits / fade if rejected |
| 27,800 | Pivot | Mid-range continuation marker — tech leadership test | Hold = constructive; lose = consolidation |
| 27,710 | Friday close | Reference anchor for Monday open | Above = continuation; below = mean revert |
| 27,400 | Support | 5-day range floor, hedge cluster | Buy zone with defined stop |
| 27,100 | Major support | Prior breakout retest level | Stop-out below for longs |
Three Scenarios Into Monday Open
Continuation
Index gaps open above 27,800 in Asia, holds 27,750 through London, runs the 28,000 round number on the NY open. Tech leads with NVDA, MSFT continuing to drive index weight. Continuation works because nothing interrupts it — light data week, no Fed speakers Monday, no earnings of consequence.
Range
Index opens flat-to-firm, churns 27,600-27,850, magnet pulled to Friday close. Tape needs a fresh catalyst. ISM Services Tuesday becomes the next read. Trade the range, don’t chase.
Mean Reversion
Index opens strong overnight, runs into 27,900 zone and meets supply, fades back below 27,500 by NY open. Failed-breakout tape. Not the base case but worth size discipline if VIX flips above 17.5.
Risk Score
Risk sits at Around 55% heading into Monday open.
Risk reflects the gap between Friday’s record close and the structural concentration of leadership. The continuation read is constructive but tech weight is doing 80 percent of the work — when index strength is that narrow, a single name’s miss can rotate the tape. Vol structure compressed but VVIX 95 says professionals are still paying up for protection. Standard-size longs make sense; oversize does not.
How to Walk It
Entry / Stop / Target structure:
- Long 27,500-27,600 | Stop 27,350 | Target 27,900 | R:R 2:1
- Long 27,800 breakout | Stop 27,650 | Target 28,000 | R:R 1.3:1
- Fade 27,950+ rejection | Stop 28,050 | Target 27,750 | R:R 2:1
Experience-level guidance:
Beginner: The Monday open after a Friday record close is exactly the situation where over-confidence costs money. Reduce size to half your standard. Trade only the cleanest setup from the entries above. If the tape opens against your bias, do nothing — wait for the second hour, when the institutional flow has tipped its hand.
Intermediate: Use the levels table to define the trading range. Fade the extremes with defined stops, take profits before the round-number resistance levels. Do not carry directional positions through the day if you cannot watch the tape — Monday opens are prone to fast reversals.
Advanced: The vol regime is supportive of trending moves. Defined-risk options structures around the key pivot levels capture the asymmetry cleanly. Keep notional small relative to your book — Monday after a record-close week is asymmetric speculation, not core positioning.
The Sunday Composite — How This Read Sits Inside The Cross-Asset View
This single-instrument framework read is one slice of the larger Sunday weekend synthesis. The composite takes positioning, macro, sentiment, volatility, sector dispersion and trade structure as separate analytical layers and arrives at a unified composite verdict for Monday open. Each layer below is unpacked in full.
Read the full composite for the cross-asset context driving this instrument:
The institutional positioning split — Asset Managers vs Leveraged Funds in size
PCE clearance and the macro case for Monday’s carry
The three-layer sentiment disagreement — surface greed, retail neutral, professionals hedged
The vol curve term structure and what VVIX is signalling
Sector dispersion and the breadth problem behind the record close
The Monday position-management playbook — sizing tiers and trade plans
Sunday Overwatch — the unified composite verdict
Continue Reading
The macro frame driving this read is unpacked in the weekend briefs:
Sunday Setup — Reading The Tape Into Monday Open
PCE Cleared, VIX Crushed, SPY Closed 720 — Friday Post-Close Recap
This analysis is for educational and informational purposes only. It does not constitute financial advice. Always manage your risk independently and in accordance with your own financial circumstances.