Microsoft (MSFT) — Daily Framework Read | Sunday 3 May 2026
Microsoft (MSFT) | Monday Open Framework Read | Data basis: Friday 1 May 2026 close
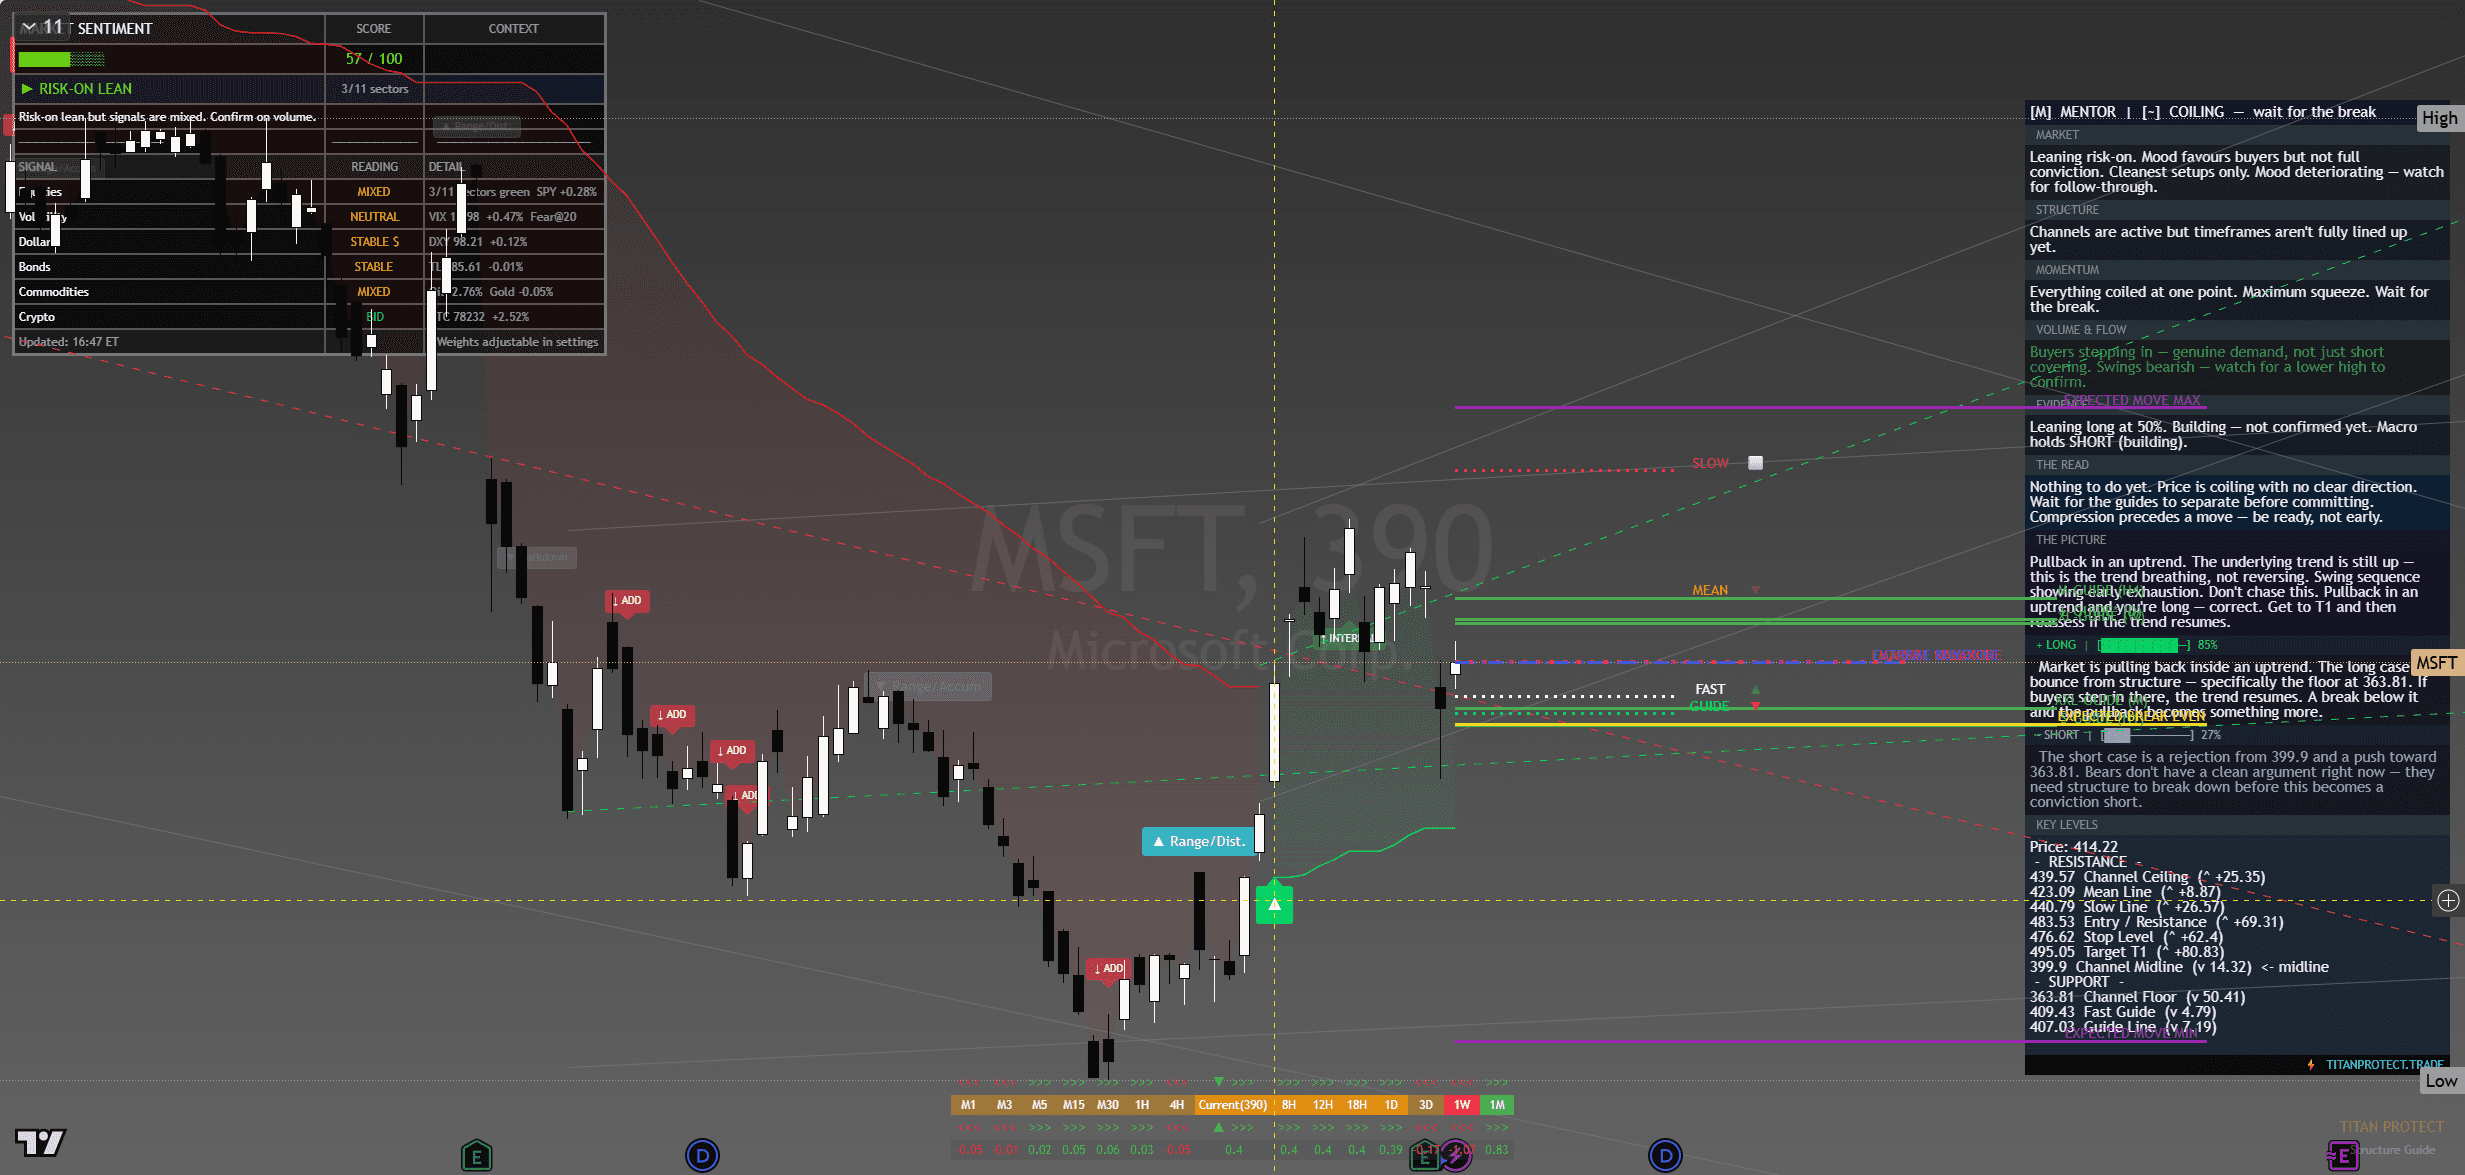
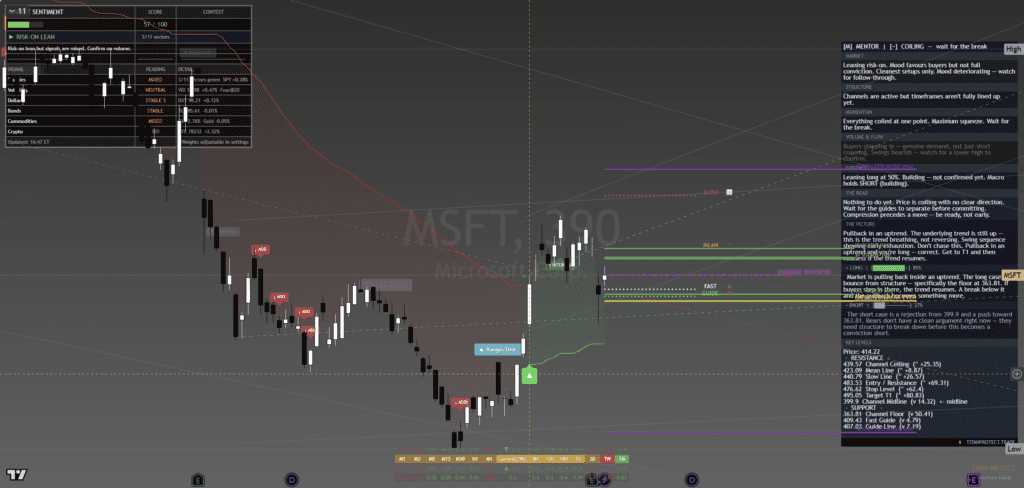
Microsoft (MSFT) — chart with framework overlay. The Lens annotations show structural breaks, reversal triggers and confluence zones at the levels referenced below.
Where It Sits
Structure
Structurally MSFT is in a clear uptrend on daily and 4-hour timeframes with higher highs and higher lows since the early-April low. Friday’s close sits in the upper-middle of the recent range. The structure is healthy.
Momentum
Momentum is positive and steady. MSFT’s recent gains have been orderly without parabolic phases. The momentum profile supports controlled continuation rather than aggressive breakout.
Volume & Flow
MSFT volume on Friday’s close was steady. Options flow has been balanced — neither aggressively bullish nor bearish. The pattern is patient accumulation.
Key Levels
| Level | Type | Significance | Action Zone |
|---|---|---|---|
| 490.00 | Resistance | Round number, recent swing high zone | Take profits if reached |
| 482.00 | Pivot | Recent rejection cluster | Hold above = bullish bias |
| 478.20 | Friday close | Reference anchor | Bias line for Monday open |
| 472.00 | Support | Recent breakout retest level | Buy zone with defined stop |
| 465.00 | Major support | Prior consolidation floor | Stop-out below for longs |
Three Scenarios Into Monday Open
Continuation
MSFT opens firm, holds 478, takes 482 cleanly on continued cloud and AI narrative. Runs to 490 round number by close. Constructive participation in the tech leadership.
Range
MSFT opens flat, churns 474-484 through the session. Magnet to Friday close. Range trade in absence of company-specific catalyst.
Mean Reversion
MSFT fades on cloud-spend narrative softening, breaks 472, runs to 465. Mean-reversion within the broader trend.
Risk Score
Risk sits at Around 50% heading into Monday open.
Risk is moderate. MSFT is the lowest-beta of the mega-cap tech leaders with the steadiest fundamental backdrop. The structure is constructive and the stock tends to participate in tech rallies without leading. The constraint is that the asymmetric trade above 482 has limited room to run before the 490 round-number resistance arrives.
How to Walk It
Entry / Stop / Target structure:
- Long 472.50-474.00 pullback | Stop 470.50 | Target 484.00 | R:R 4:1
- Long 482.50 breakout | Stop 478.00 | Target 490.00 | R:R 1.7:1
- Short 491+ rejection | Stop 494.00 | Target 482.00 | R:R 3:1
Experience-level guidance:
Beginner: The Monday open after a Friday record close is exactly the situation where over-confidence costs money. Reduce size to half your standard. Trade only the cleanest setup from the entries above. If the tape opens against your bias, do nothing — wait for the second hour, when the institutional flow has tipped its hand.
Intermediate: Use the levels table to define the trading range. Fade the extremes with defined stops, take profits before the round-number resistance levels. Do not carry directional positions through the day if you cannot watch the tape — Monday opens are prone to fast reversals.
Advanced: The vol regime is supportive of trending moves. Defined-risk options structures around the key pivot levels capture the asymmetry cleanly. Keep notional small relative to your book — Monday after a record-close week is asymmetric speculation, not core positioning.
The Sunday Composite — How This Read Sits Inside The Cross-Asset View
This single-instrument framework read is one slice of the larger Sunday weekend synthesis. The composite takes positioning, macro, sentiment, volatility, sector dispersion and trade structure as separate analytical layers and arrives at a unified composite verdict for Monday open. Each layer below is unpacked in full.
Read the full composite for the cross-asset context driving this instrument:
The institutional positioning split — Asset Managers vs Leveraged Funds in size
PCE clearance and the macro case for Monday’s carry
The three-layer sentiment disagreement — surface greed, retail neutral, professionals hedged
The vol curve term structure and what VVIX is signalling
Sector dispersion and the breadth problem behind the record close
The Monday position-management playbook — sizing tiers and trade plans
Sunday Overwatch — the unified composite verdict
Continue Reading
The macro frame driving this read is unpacked in the weekend briefs:
Sunday Setup — Reading The Tape Into Monday Open
PCE Cleared, VIX Crushed, SPY Closed 720 — Friday Post-Close Recap
This analysis is for educational and informational purposes only. It does not constitute financial advice. Always manage your risk independently and in accordance with your own financial circumstances.
Continue with Titan Protect
Twenty-plus instruments. One framework.
We read more than twenty instruments daily across four sessions. The framework’s sunrise call landed across the day — the Pre-NY case study shows what the lines drew, what New York did, and where the read stands.
Core
£59/mo
Indicator suite plus daily framework reads.
Edge Popular
£109/mo
Core plus Shield dashboard and member-only briefs.
Elite
£179/mo
Edge plus weekly 1:1 call and early access to new tools.
Save 15% on annual billing
Want to see the framework in action? Free Explorer tier — no card required.
Join the live community: Discord channel · Shield dashboard
Education, not financial advice. Trade your own analysis.