FTSE 100 — Daily Framework Read | Sunday 3 May 2026
FTSE 100 | Monday Open Framework Read | Data basis: Friday 1 May 2026 close
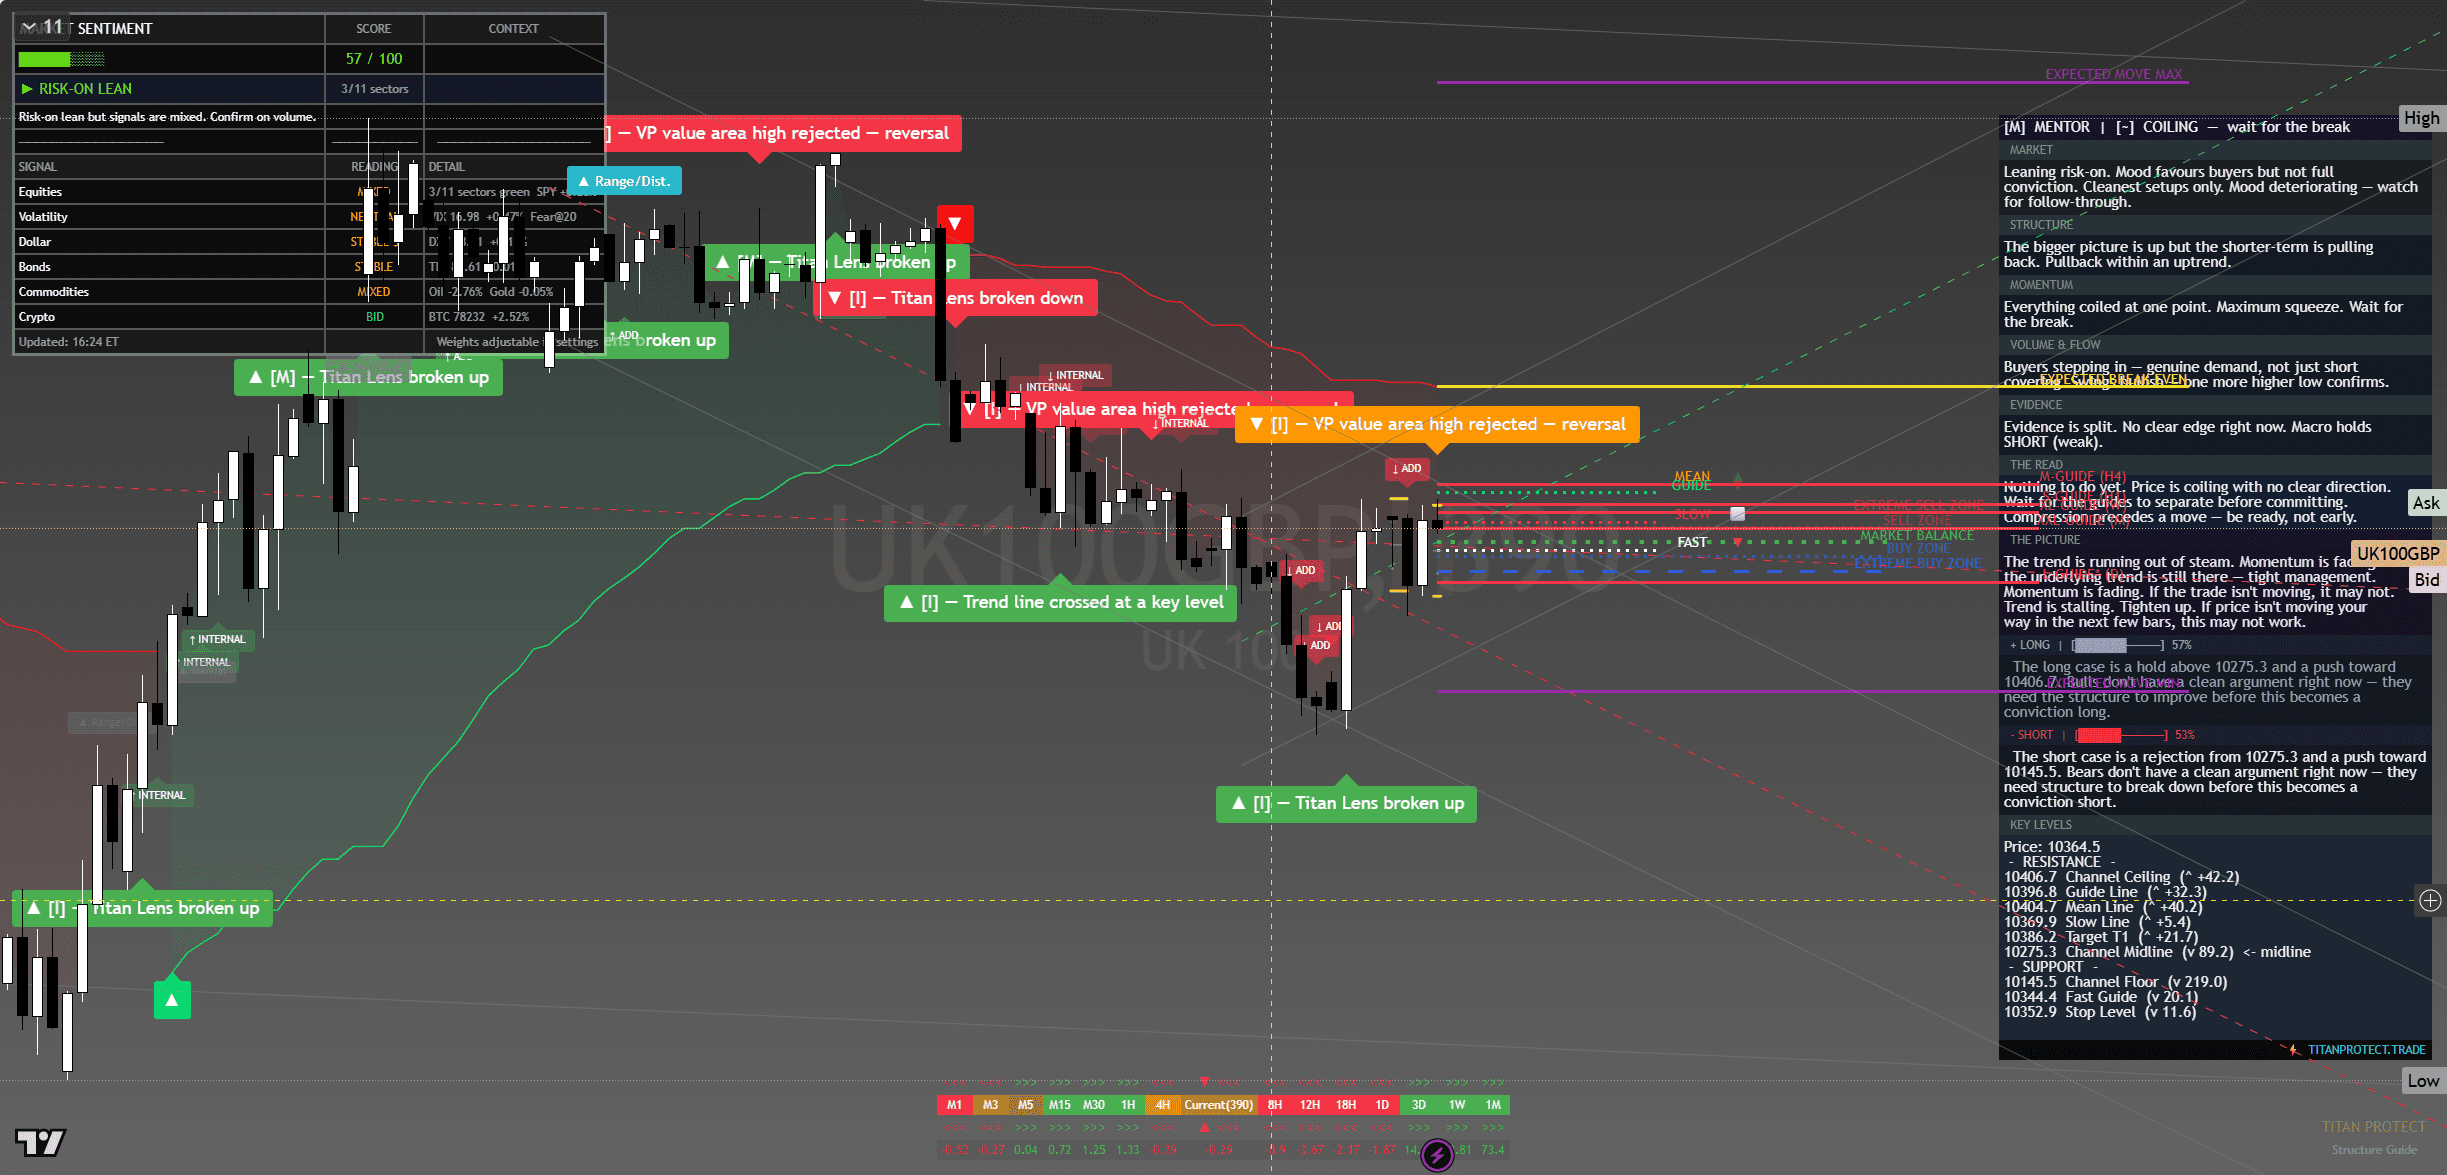
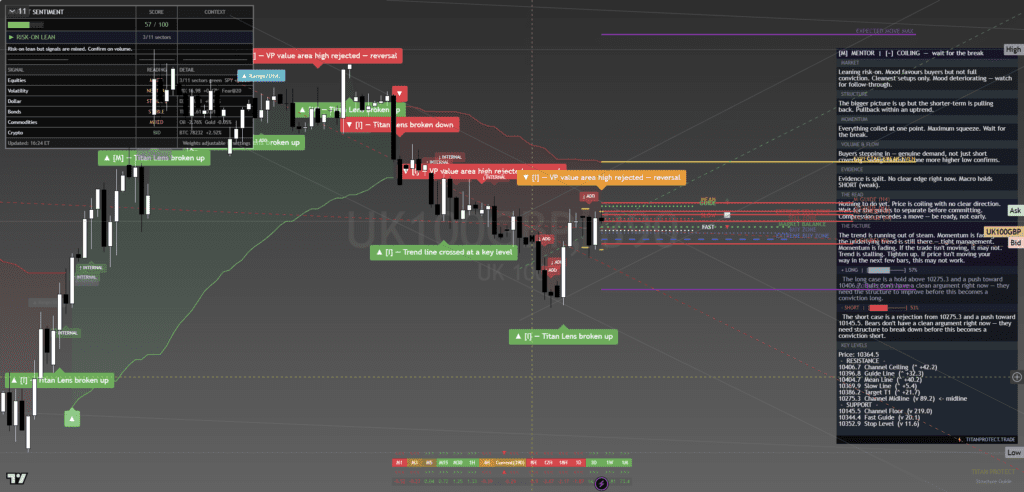
FTSE 100 — chart with framework overlay. The Lens annotations show structural breaks, reversal triggers and confluence zones at the levels referenced below.
Where It Sits
Structure
Structurally the index has been climbing in an orderly fashion since the late-April low. Friday’s close holds above the breakout zone from earlier in the week and above the rising 20-day moving average. The structure is constructive but not stretched — there is no sign of distribution or topping behaviour on the daily timeframe.
Momentum
Momentum is positive but unspectacular. The UK index has been a quiet performer relative to the US — gains have come without leadership and without enthusiasm. That is actually a constructive sign because it means the move has not been crowded. The risk is that momentum stalls if global enthusiasm fades.
Volume & Flow
Volume has been thin on the recent advance, which is the typical UK summer-tape pattern even in May. Breadth is mediocre — the index gains are concentrated in financials and a handful of large miners. When participation is narrow, the index trades with the leaders rather than independently.
Key Levels
| Level | Type | Significance | Action Zone |
|---|---|---|---|
| 9,550 | Resistance | Round number, prior monthly high zone | Take profits if reached |
| 9,500 | Pivot | Round-number trigger for next leg | Hold above = continuation |
| 9,485 | Friday close | Reference anchor | Bias line for Monday open |
| 9,420 | Support | Breakout retest zone | Buy zone with defined stop |
| 9,350 | Major support | Multi-week range floor | Stop-out below for longs |
Three Scenarios Into Monday Open
Continuation
Index opens firm in London, follows US tape, takes 9,500 round number cleanly. Energy and miners contribute. Closes near 9,520. Pattern: textbook continuation in the absence of UK-specific catalyst.
Range
Index opens flat, churns 9,460-9,510 through the session. UK markets follow the US lead but without a domestic catalyst, range trade dominates. Magnet pulled to Friday close.
Mean Reversion
Index opens weak on USD strength or oil weakness, fades to 9,420 support, holds the level on a clean test. Mean-reversion within the broader uptrend. Not the base case but possible on energy-sector drag.
Risk Score
Risk sits at Around 45% heading into Monday open.
Risk is moderate-low. The UK index is a follower not a leader on Monday open with US markets driving the global mood. The constraint is pound strength against the dollar — a sharp GBPUSD move can shift the index’s competitiveness profile and hit the export-sensitive components. Standard sizing within the established range, no aggressive new entries on weekend gaps.
How to Walk It
Entry / Stop / Target structure:
- Long 9,440-9,460 pullback | Stop 9,400 | Target 9,520 | R:R 2:1
- Long 9,505 breakout | Stop 9,475 | Target 9,550 | R:R 1.5:1
- Fade 9,560+ rejection | Stop 9,580 | Target 9,485 | R:R 3:1
Experience-level guidance:
Beginner: The Monday open after a Friday record close is exactly the situation where over-confidence costs money. Reduce size to half your standard. Trade only the cleanest setup from the entries above. If the tape opens against your bias, do nothing — wait for the second hour, when the institutional flow has tipped its hand.
Intermediate: Use the levels table to define the trading range. Fade the extremes with defined stops, take profits before the round-number resistance levels. Do not carry directional positions through the day if you cannot watch the tape — Monday opens are prone to fast reversals.
Advanced: The vol regime is supportive of trending moves. Defined-risk options structures around the key pivot levels capture the asymmetry cleanly. Keep notional small relative to your book — Monday after a record-close week is asymmetric speculation, not core positioning.
The Sunday Composite — How This Read Sits Inside The Cross-Asset View
This single-instrument framework read is one slice of the larger Sunday weekend synthesis. The composite takes positioning, macro, sentiment, volatility, sector dispersion and trade structure as separate analytical layers and arrives at a unified composite verdict for Monday open. Each layer below is unpacked in full.
Read the full composite for the cross-asset context driving this instrument:
The institutional positioning split — Asset Managers vs Leveraged Funds in size
PCE clearance and the macro case for Monday’s carry
The three-layer sentiment disagreement — surface greed, retail neutral, professionals hedged
The vol curve term structure and what VVIX is signalling
Sector dispersion and the breadth problem behind the record close
The Monday position-management playbook — sizing tiers and trade plans
Sunday Overwatch — the unified composite verdict
Continue Reading
The macro frame driving this read is unpacked in the weekend briefs:
Sunday Setup — Reading The Tape Into Monday Open
PCE Cleared, VIX Crushed, SPY Closed 720 — Friday Post-Close Recap
This analysis is for educational and informational purposes only. It does not constitute financial advice. Always manage your risk independently and in accordance with your own financial circumstances.