Crude Oil (WTI) — Daily Framework Read | Sunday 3 May 2026
Crude Oil (WTI) | Monday Open Framework Read | Data basis: Friday 1 May 2026 close
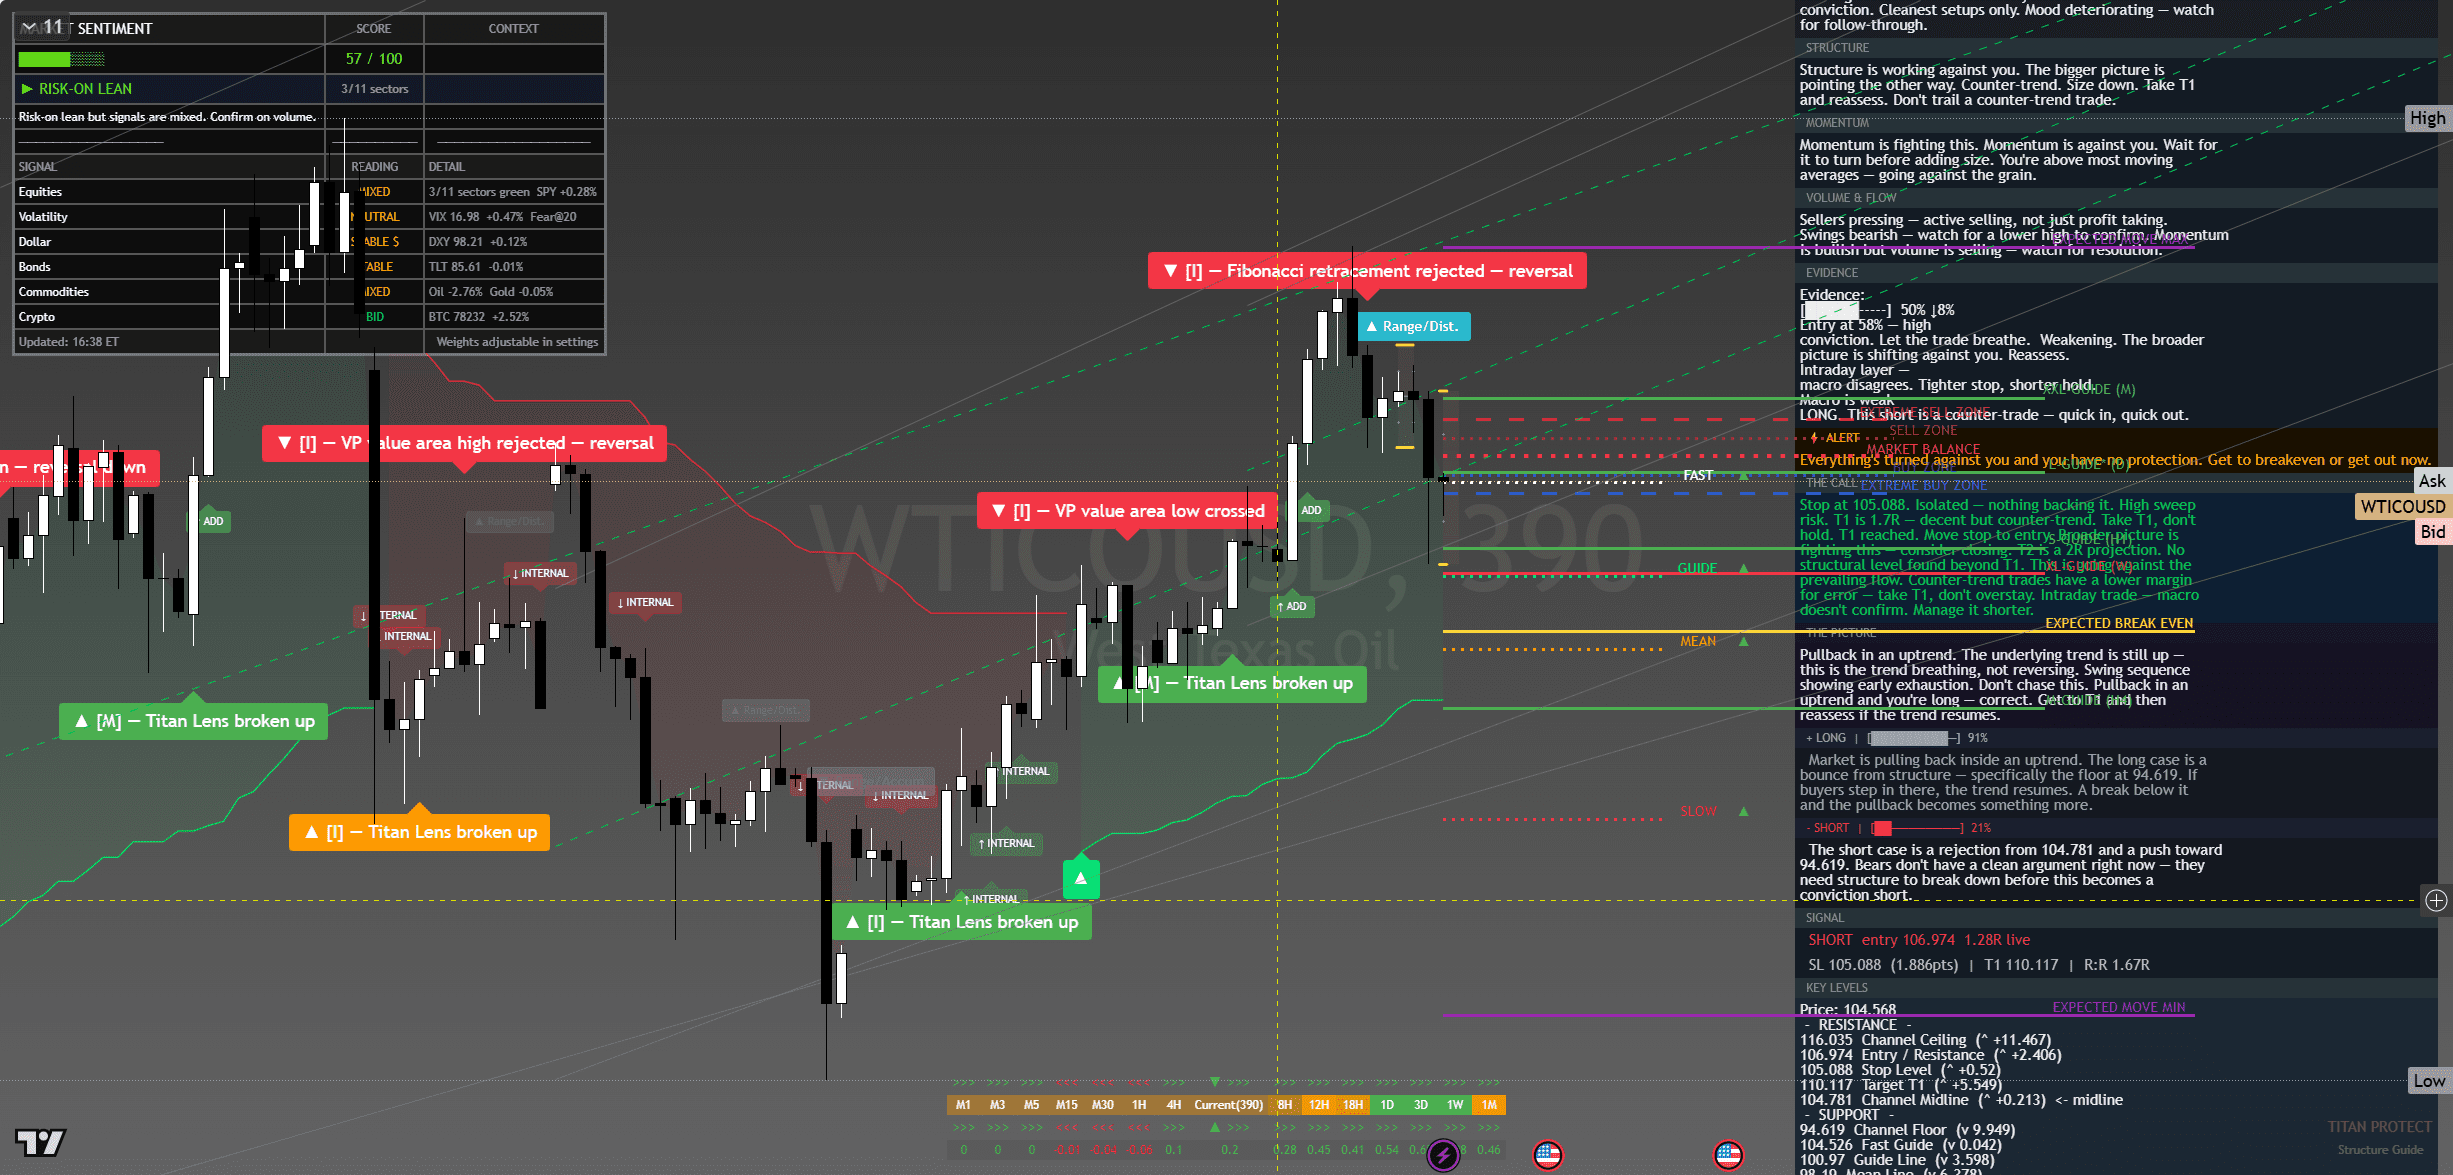
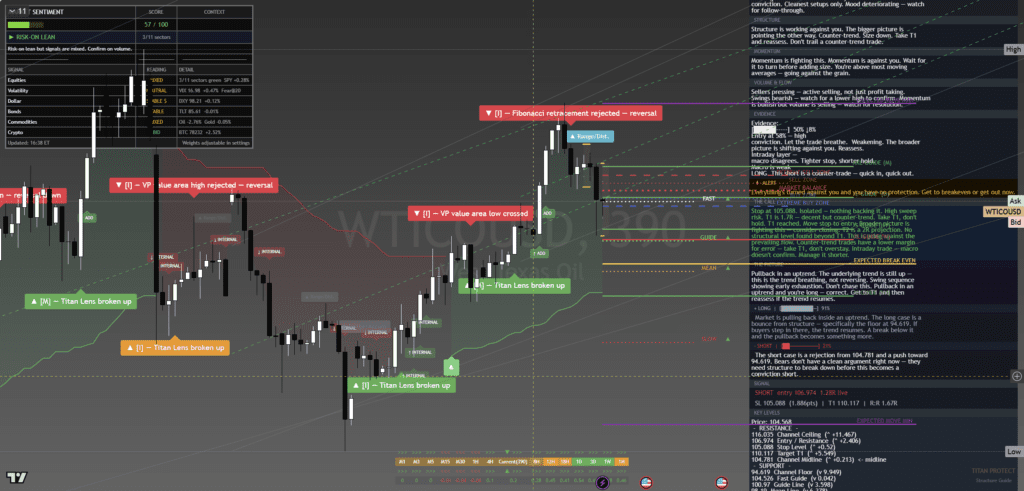
Crude Oil (WTI) — chart with framework overlay. The Lens annotations show structural breaks, reversal triggers and confluence zones at the levels referenced below.
1. Where It Sits — The Composite Read
Crude is the standout strength of the past week. Up 6.63 percent Mon-to-Fri (95.60 → 104.57), it outpaced every other major instrument by a wide margin — silver came second at +1.55 percent, BTC third at +3.43 percent. Nothing else moved like crude moved.
The framework’s read coming into Monday integrates three layers that align: structurally bullish on the higher timeframe (clean breakout above the 95-100 multi-week range, three consecutive sessions holding above 100), tactically constructive on the daily timeframe (rising 20-day MA now acting as support, not resistance), and cautious near-term on the 4-hour timeframe (Friday’s give-back signals digestion not continuation, momentum cooling from upper-third to middle-of-range readings).
The Mentor frame for Monday open is direct: pullback within an uptrend, do not chase, wait for either tested-support hold OR breakout-reclaim before adding. The week’s rally has done the work. The next leg up needs either a fresh catalyst (OPEC commentary, geopolitical headline, EIA inventory surprise) or a clean consolidation pattern that resolves higher.
2. Structure
The structural picture is the cleanest it has been since the early-April low. Crude broke OUT of the 95-100 multi-week range earlier in the week and has held above 100 for three consecutive sessions. That is the kind of confirmation that turns prior resistance into reliable support and unlocks the next structural target zone.
Higher timeframe (daily/weekly): Multi-week uptrend with higher highs and higher lows. The breakout above 100 is the structural inflection — until that level fails, the daily trend is firmly higher. The next major resistance zone is 108-110 where prior weekly highs cluster. The major support is now 100 (the breakout level) and 95 (the prior range floor).
Lower timeframe (4-hour/intraday): Friday’s session showed a clean rejection candle at the 106 zone — what was the intraday high mid-week — and price gave back to 104.57. The 4-hour structure has flattened from accelerating to consolidating, which is healthy after a 6.6 percent weekly move. The compression zone between 102.50 and 106 is where Monday’s tape will likely play out absent a catalyst.
This is the textbook flag pattern after a breakout: aggressive run higher, consolidation in a tight range above the breakout level, eventual continuation if the breakout is real. The risk is that the consolidation extends into a failed-breakout pattern — which would be confirmed on a clean break below 102.50 with volume.
3. Momentum
Momentum was firmly accelerating through Monday-Wednesday — that drove the 6.6 percent weekly move. Internal momentum readings printed in the upper third of their range during that phase. Thursday-Friday showed the natural cooldown: momentum readings pulled back to the upper-middle of the range. Not exhaustion. Not reversal. Just the digestion phase that allows positioning to rebalance after a strong run.
The cross-asset momentum context matters: crude’s strength came alongside DXY weakness (-1.13% on the week) AND alongside SPX records. Normally a strong dollar caps crude and a risk-on equity tape supports crude through the demand narrative. This week both vectors aligned in crude’s favour — that is partly why the move was so sharp. The risk for Monday is that if either vector reverses (DXY catches a bid OR equities sell off), crude loses one of its supporting legs.
4. Volume & Flow
Crude futures flow through the week showed the cleanest accumulation pattern of any major instrument. Non-commercial long positioning built progressively Mon-Thu — that is real institutional money committing to the breakout, not a speculative spike. Friday’s flow was lighter but not distribution — the kind of profit-taking that consolidates the prior advance rather than reverses it.
Brent crude moved in lockstep at +6.63 percent week (107.62 close vs 101.94 prior week), confirming the move is global rather than WTI-specific. The Brent-WTI spread held at $3.05 — historically tight, which signals the demand pull is structural rather than localised. When the spread compresses, crude markets are arbitraging tighter — bullish read.
5. Key Levels
| Level | Type | Significance | Action Zone |
|---|---|---|---|
| 108.00 | Resistance | Round-number stretch zone, prior weekly high cluster | Take profits if reached |
| 106.00 | Pivot | Mid-range trigger, Friday’s rejection level — supply cluster | Hold above = bullish bias resumes |
| 104.57 | Friday close | Reference anchor for Monday open | Bias line — above = constructive, below = consolidation extending |
| 102.50 | Support | Recent breakout retest level + structural decision point | Buy zone with defined stop on tested hold |
| 101.00 | Major support | Prior congestion floor, just above the 100 round-number breakout level | Stop-out below for longs — break invalidates the structural read |
| 100.00 | Structural floor | The breakout level — losing this turns the breakout into a failed breakout | Defensive posture below — full retreat from longs |
6. Three Scenarios Into Monday Open
Continuation
Crude opens firm, holds 104.50, takes 106.00 cleanly during the London session on continued supply-tightness narrative or OPEC commentary. Runs to 108.00 round number by NY close. The flag-pattern resolution that confirms the multi-week breakout. Trade with the trend on tested support.
Range
Crude opens flat, churns 103.50-106.00 through the session. Magnet pulled to Friday close. Range trade in absence of fresh OPEC or geopolitical catalyst. Most probable scenario given the EIA inventory release Wednesday — the market waits for fresh data before committing to the next leg.
Mean Reversion
Crude opens weak on demand worries, USD strength, or unexpected supply news. Breaks 102.50 on volume, runs to 101.00. The flag becomes a failed breakout pattern. Mean-reversion within the broader weekly uptrend. Watch for capitulation candle at 100 — that becomes the long entry rather than the stop.
7. Risk Score
Risk sits at Around 55% heading into Monday open.
Three factors drive this moderate-elevated reading. First, crude is up 6.63 percent on the week — the asymmetry of new long entries above 104 has deteriorated significantly. Second, crude is the most headline-sensitive instrument in the major complex; a single OPEC member statement or unexpected inventory print can move the tape 3-5 percent in either direction. Third, the supporting cross-asset vectors (weak dollar, risk-on equities) are both at extremes and any reversal in either creates outsized impact on crude.
The 45 percent relief from maximum risk reflects the multi-week breakout structure remaining intact, the institutional long positioning building progressively (real money, not speculation), the Brent confirmation of the global demand story, and the supply-tightness narrative still supportive. Standard size on tested-support pullbacks (102.50-103.50). Reduced size on aggressive new entries above 106 without confirmation. Full retreat on a clean break below 100.
8. How To Walk It
Entry / Stop / Target structure:
- Long 102.80-103.20 pullback | Stop 102.00 | Target 106.00 | R:R 3:1
- Long 106.10 breakout reclaim | Stop 105.20 | Target 108.00 | R:R 2:1
- Short 108.50+ rejection | Stop 109.50 | Target 105.00 | R:R 3:1
- Long 100.50-101.00 capitulation bounce | Stop 99.50 | Target 104.00 | R:R 4:1 (asymmetric — only if support holds with volume confirmation)
Experience-level guidance:
Beginner. Crude this week is the textbook example of why “do not chase strength” matters. The trade was the breakout above 100 on Tuesday. By Friday close at 104.57, the asymmetry of new longs has compressed significantly. Skip the chase. Wait for a pullback to 102.50-103 with confirmation, OR wait for the 106 reclaim. If you cannot wait, sit out and watch — there will be more setups.
Intermediate. The asymmetric setup is the long at 102.80-103.20 with stop 102.00 and target 106.00. R:R 3:1 with confluence between the daily uptrend and the 4-hour pullback. Take half off at 105 and trail the rest to 106. The headline-sensitivity means you do NOT carry crude positions through OPEC or EIA windows without trailing stops to break-even — single news prints can wipe out 3-5 percent in minutes.
Advanced. The volatility structure on crude options has expanded with the spot rally — implied vol is in the upper-third of the 30-day range. Defined-risk option structures around the 102 / 108 levels capture the range scenario cleanly with positive theta if Monday consolidates. Sized to 0.5% notional per leg. The asymmetric trade for advanced traders this week is the WTI-Brent spread: at $3.05 it is historically tight; long Brent / short WTI is a mean-reversion play if the spread normalises back to $5+.
9. The One Sentence
The Sunday Composite — How This Read Sits Inside The Cross-Asset View
This single-instrument framework read is one slice of the larger Sunday weekend synthesis. The composite takes positioning, macro, sentiment, volatility, sector dispersion and trade structure as separate analytical layers and arrives at a unified composite verdict for Monday open. Each layer is unpacked in full.
Read the full composite for the cross-asset context driving this instrument:
The institutional positioning split — Asset Managers vs Leveraged Funds in size
PCE clearance and the macro case for Monday’s carry
The three-layer sentiment disagreement
The vol curve term structure and what VVIX is signalling
Sector dispersion and the breadth problem behind the record close
The Monday position-management playbook — sizing tiers and trade plans
Sunday Overwatch — the unified composite verdict
This analysis is for educational and informational purposes only. It does not constitute financial advice. Always manage your risk independently and in accordance with your own financial circumstances.
Continue with Titan Protect
Twenty-plus instruments. One framework.
We read more than twenty instruments daily across four sessions. The framework’s sunrise call landed across the day — the Pre-NY case study shows what the lines drew, what New York did, and where the read stands.
Core
£59/mo
Indicator suite plus daily framework reads.
Edge Popular
£109/mo
Core plus Shield dashboard and member-only briefs.
Elite
£179/mo
Edge plus weekly 1:1 call and early access to new tools.
Save 15% on annual billing
Want to see the framework in action? Free Explorer tier — no card required.
Join the live community: Discord channel · Shield dashboard
Education, not financial advice. Trade your own analysis.