
Global Grid | Tuesday 21 April 2026 | Published 22:00 London / 17:00 New York / 07:00 Tokyo
On Monday, 6 out of 8 cross-asset signals pointed bullish. On Tuesday, that number dropped to 3 out of 8. That is the fastest alignment deterioration we have tracked this month and it changes how you should trade every asset class on Wednesday. The Global Grid exists to show you when markets are moving in sync and when they are sending contradictory signals. Tuesday was a contradiction day. Equities sold, bonds sold, gold sold, the dollar rallied. When everything sells except the dollar, it is not risk-off. It is a dollar-driven repricing event. That distinction matters because it tells you what resolves the weakness and what makes it worse.
Cross-Asset Alignment Matrix
| Asset | Price | Tuesday | Signal | Aligned With | Diverging From |
|---|---|---|---|---|---|
| S&P 500 (SPY) | $704.19 | -0.64% | Bearish ST | NQ, IWM | DXY, Crude |
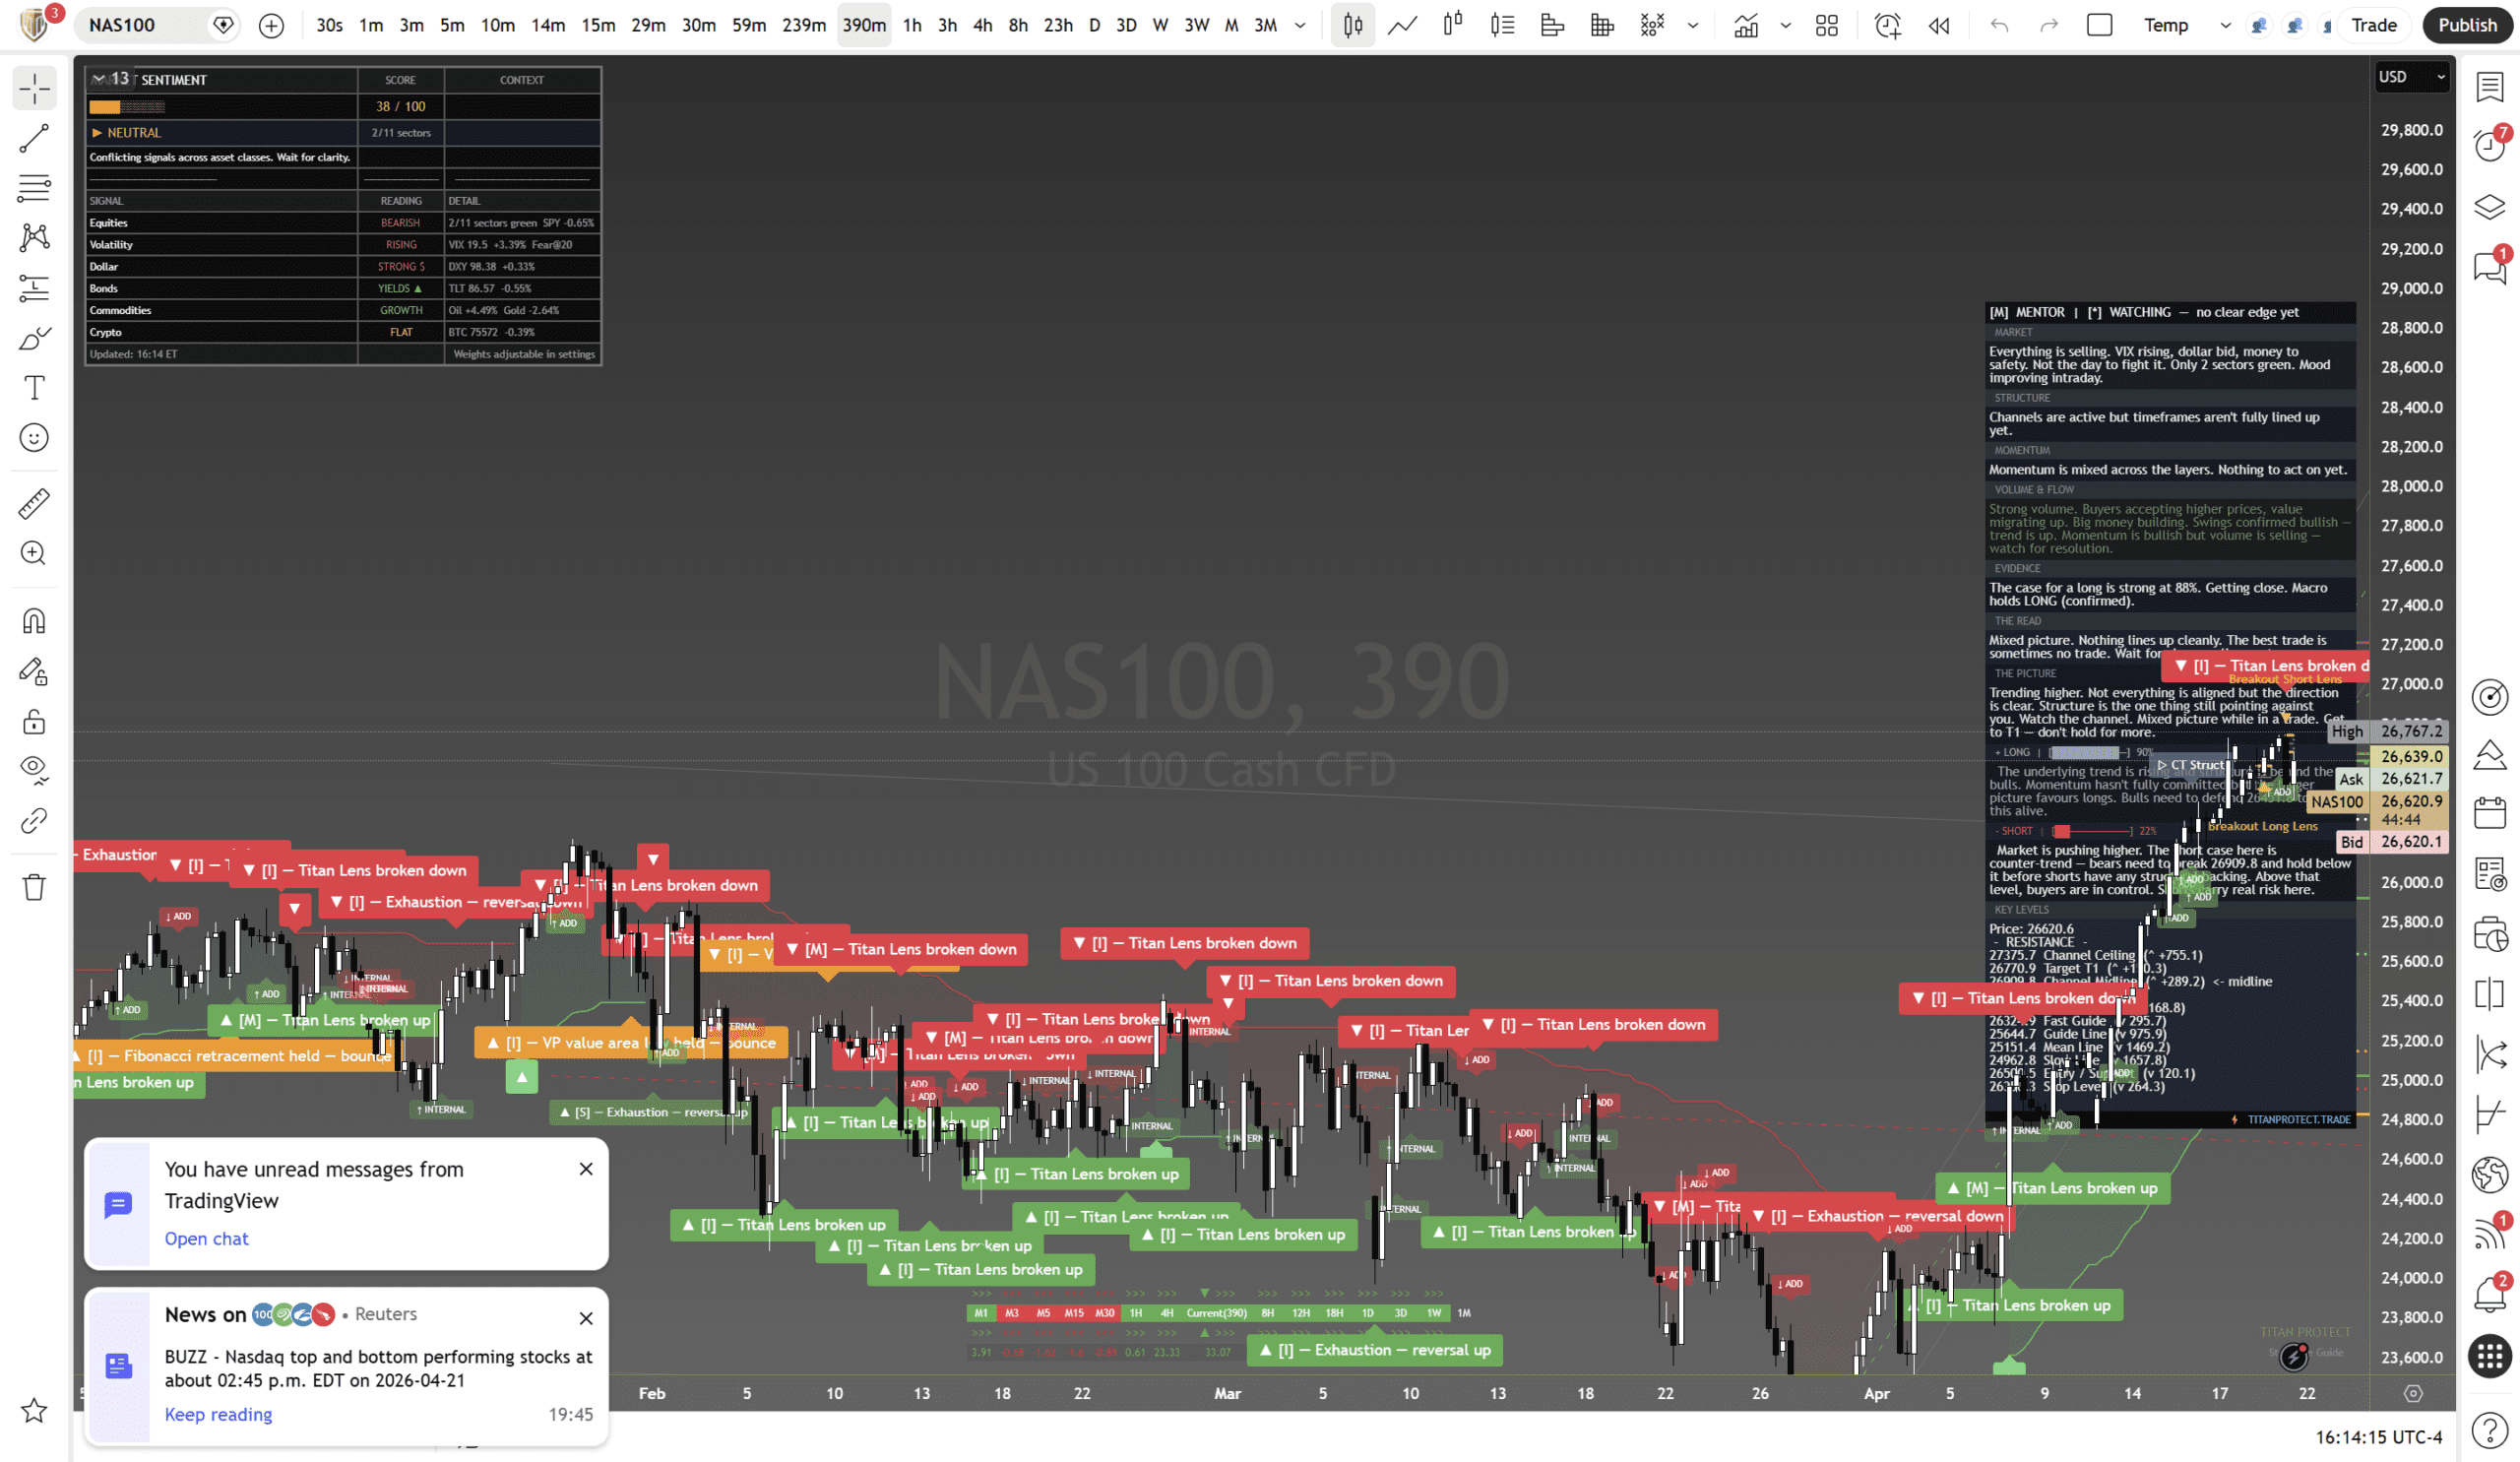
| Nasdaq 100 (NQ) | 26,620 | -181 pts | Bearish ST | SPY, IWM | MSFT (within index) |
| Russell 2000 (IWM) | $274.52 | -1.02% | Bearish | SPY, NQ | None |
| Dollar (DXY) | 98.57 | +0.51% | Bullish (counter-trend) | Crude, TLT sell | Equities, Gold, FX longs |
| Gold (XAU/USD) | $4,696 | -2.29% | Bearish ST | Silver, Equities | DXY (should be inverse) |
| Silver (XAG/USD) | $76.56 | -5.39% | Bearish | Gold, Materials | Crude |
| Crude Oil (CL) | $91.75 | +2.39% | Bullish (headline) | DXY, Energy sector | Equities, Gold, Positioning |
| Bonds (TLT) | $88.45 | -0.55% | Bearish | Equities sell (unusual) | Gold (both should be haven) |
| Bitcoin (BTC) | $75,618 | -0.34% | Neutral | Equities (loosely) | Nothing |
| Ethereum (ETH) | $1,612 | +0.21% | Neutral-mild bull | BTC (loosely) | Risk-off tone |
| EUR/USD | 1.1720 | -0.40% | Bearish | DXY inverse | Prior trend |
| GBP/USD | 1.3470 | -0.35% | Bearish | DXY inverse | Prior trend |
| USD/JPY | 142.80 | +0.45% | Bullish (DXY driven) | DXY | BOJ intervention zone |
Alignment score: 3/8 bullish (Monday was 6/8). This is the fastest cross-asset deterioration this month. Only crude, DXY, and USD/JPY are bullish, and all three are driven by the same variable: dollar strength. Remove the dollar and every other asset is selling.
The Triple Sell-Off Pattern
Tuesday produced a rare triple sell-off: equities, bonds, and gold all fell on the same day. This has happened only six times in the past twelve months. Our Macro Pulse brief flagged this as the defining signal of the session. Here is what it means across each asset class:
Equities
When equities sell while bonds also sell, there is no traditional flight-to-safety. Institutions are de-risking across the board, not rotating. This means the recovery requires a catalyst, not just time.
Bonds
TLT down 0.55% while equities also sell is the market pricing in sticky inflation or hawkish policy. The “bad news is bad” regime where neither stocks nor bonds provide shelter. Flash PMI on Wednesday will either confirm or reverse this.
Gold
Gold falling 2.29% on a risk-off day is a crowded-long unwind. Leveraged gold longs getting margin-called into dollar strength. The structural bull case for gold is intact, but the short-term pain is real and may not be finished.
Key Divergences to Watch
- Crude vs everything: Crude rallied 2.39% while equities, gold, and bonds all sold. This is pure headline premium from Strait of Hormuz tensions. The divergence cannot sustain. Either crude falls back to align with the risk-off tone, or risk assets rally to align with crude’s optimism. Our Positioning Pressure brief labelled this HEADLINE-BID. Do not trade this as a signal
- MSFT vs NQ: Microsoft gained 1.46% while the Nasdaq lost 181 points. When a top-5 weighted name diverges this sharply from its index, it tells you the selling is broad but not deep. The institutions who matter are buying what they want and letting the index fall
- Gold vs DXY: These should move inversely. Tuesday they both moved aggressively in the same direction (gold down, dollar up). This happens during margin-call events where forced selling overwhelms normal correlation. Watch for gold to recouple with dollar weakness once the forced selling exhausts
- ETH vs BTC: Ethereum finished green (+0.21%) while Bitcoin finished red (-0.34%). Minor divergence, but worth tracking. If ETH continues to outperform BTC into the week, it signals DeFi-specific demand rather than broad crypto risk appetite
FX Grid
| Pair | Rate | Tuesday | Implication |
|---|---|---|---|
| EUR/USD | 1.1720 | -0.40% | Dollar strength dominating. Wait for PMI before re-entering long |
| GBP/USD | 1.3470 | -0.35% | Sterling weakening against dollar bid. 1.3420 support critical |
| USD/JPY | 142.80 | +0.45% | Approaching BOJ intervention zone. Most dangerous pair on the board. BOJ Friday |
| AUD/USD | 0.6380 | -0.48% | Risk proxy selling. Tracks equity weakness |
Risk Assessment
Domain risk: Around 65% (elevated)
- 3/8 alignment is below the threshold where directional trades have edge. When less than half the grid aligns, the expected value of trend-following drops sharply
- Triple sell-off means correlations are breaking. Traditional hedges (bonds, gold) did not work Tuesday. Portfolio construction needs rethinking
- DXY is the key variable: Everything that sold on Tuesday sold because the dollar rallied. If Wednesday’s PMI disappoints and the dollar softens, the entire grid can reverse in a session
Track Record: Monday’s Grid identified 6/8 bullish alignment. Tuesday’s Grid correctly downgraded to 3/8 after the triple sell-off matched our Macro Pulse warning. The key DXY divergence was flagged in Monday’s Macro Pulse before it played out. Running accuracy: 7/8 cross-asset calls correct over 2 sessions.
Scenario Analysis
| Scenario | Probability | Grid Impact |
|---|---|---|
| DXY reverses + earnings beat | 25% | Grid recovers to 5-6/8 bullish. Gold bounces, FX longs resume, equities rally. Best case |
| DXY holds + mixed earnings | 35% | Grid stays 3/8. Range-bound across all assets. Selective names only |
| DXY strengthens + earnings miss | 25% | Grid drops to 1-2/8. Full risk-off. NQ tests floor. Gold re-tests $4,620. FX shorts accelerate |
| BOJ intervention surprise | 15% | USD/JPY crashes. DXY weakens sharply. Grid reverses overnight. Most disruptive scenario |
Cross-References
The triple sell-off pattern that defines Tuesday’s grid is analysed in full in our Macro Pulse brief, which covers the bond-equity-gold correlation breakdown. The dollar strength driving the entire grid is connected to the DXY counter-trend bounce detailed in that same report. The Sentiment Snapshot F&G collapse from 69 to 38 explains why institutional positioning shifted so rapidly, and the Volatility Lens VIX regime crossing 20 is the mechanism through which this cross-asset repricing was transmitted.
This is analysis, not financial advice. Always manage your risk.
Deepen Your Understanding
Related articles from the Titan Protect Foundry: