Trader Mindset Series
Understanding Risk-to-Reward
Why a 40% win rate can still build an account, and why a 70% win rate can still drain one.
The Number That Matters More Than Win Rate
Most traders track their win rate religiously. It feels intuitive. More wins than losses means a profitable account, right? Not necessarily. Win rate without context is almost meaningless. A trader winning 70% of their trades but taking 1-point winners and 4-point losers is losing money steadily. A trader winning 35% of their trades but capturing 3 points for every 1 they risk is building an account.
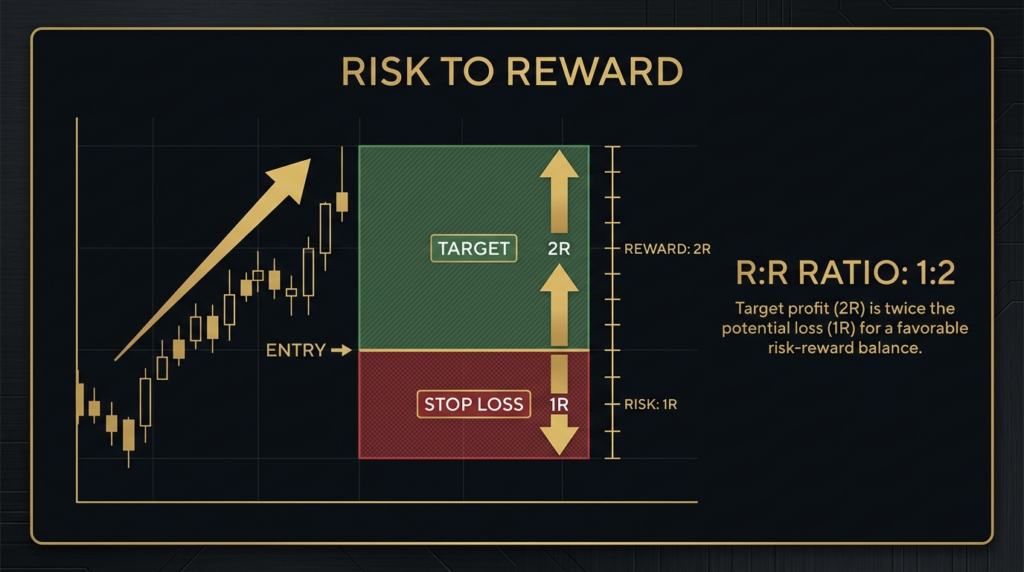
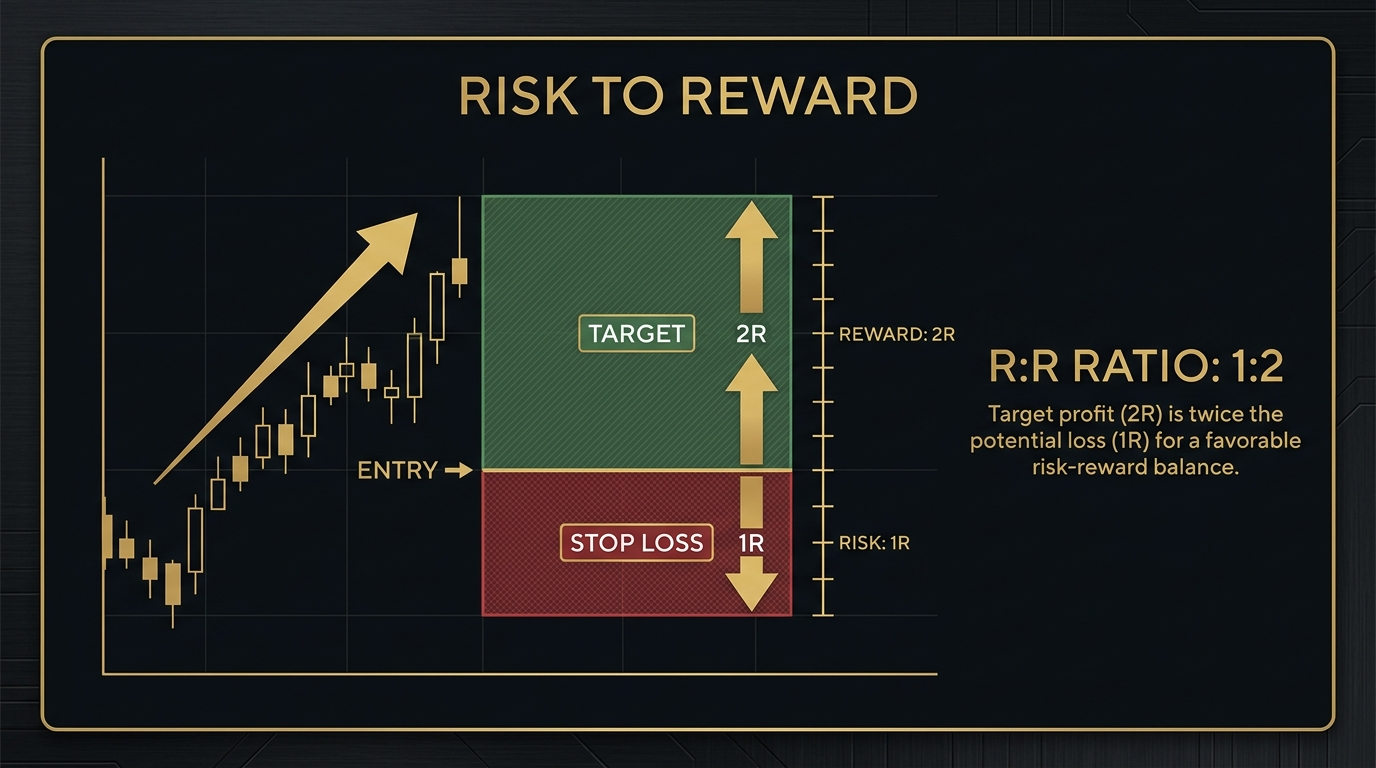
Risk-to-reward, or R:R, is the ratio between what you risk on a trade and what you stand to gain. A trade with a 20-point stop and a 60-point target has a risk-to-reward of 1:3. For every pound you put at risk, you are aiming to make three back.
Understanding this ratio, and applying it consistently, is what makes trading a business rather than a coin flip.
Why 1:1 Is Not Enough
At 1:1, you need to win more than 50% of your trades just to break even after spreads and commissions. In practice, most strategies encounter periods of drawdown where the win rate dips. If your R:R is 1:1 and you hit a losing streak of ten trades, your account has taken a serious hit with no buffer from outsized winners to pull it back.
Professional traders generally target a minimum of 1:2. This means a 34% win rate is the theoretical breakeven point. In a real drawdown where you might drop to 25% or 30% for a spell, the account survives because the wins are larger than the losses.
The goal is not to chase enormous R:R on every trade. It is to build setups where the reward is meaningfully larger than the risk, and to be disciplined enough not to cut winners short before they get there.
The Win Rate and R:R Relationship
These two numbers are linked. A higher R:R allows you to be profitable with a lower win rate. A lower R:R demands a higher win rate to stay positive. The table below shows the minimum win rate required to break even at different R:R levels, ignoring transaction costs.
| Risk-to-Reward Ratio | Breakeven Win Rate | Profitable If Win Rate Exceeds | Realistic For |
|---|---|---|---|
| 1:1 | 50% | 55%+ (after costs) | Scalping at very low spread cost |
| 1:1.5 | 40% | 45%+ | Active day trading with tight setups |
| 1:2 | 33% | 38%+ | Standard day and swing trading |
| 1:3 | 25% | 30%+ | Trend following, swing trades |
| 1:4 | 20% | 25%+ | Position trades at major structural levels |
| 1:5+ | 17% | 22%+ | High-conviction macro plays, rare setups |
The practical implication: if you know your strategy has a win rate of around 45%, you need an average R:R of at least 1:1.5 to stay profitable. This is not theoretical. It is the arithmetic that your account is subject to regardless of how you feel about it.
How to Calculate R:R From the Chart
Calculating R:R properly means reading it from price structure, not from a fixed percentage or arbitrary pip count.
Step 1 — Define your entry. Where exactly are you getting in? Is it at market, on a limit order at a retest, or at a breakout confirmation? The entry price must be specific.
Step 2 — Define the structural stop. Where is the trade invalidated? This is where the stop lives, not where you think you can afford to put it.
Step 3 — Define the target. Where is the next meaningful structural level in the direction of the trade? This might be a prior high, a key resistance zone, or a measured move target. If there is no clear target visible on the chart, the trade likely does not have a good R:R yet.
Step 4 — Do the maths. (Target – Entry) divided by (Entry – Stop) for a long. That ratio is your R:R. If it is below 1:1.5, you either need a better entry, a tighter stop, or a more ambitious target — or you pass on the trade entirely.
The Trap of Chasing High R:R Without Context
There is a version of R:R thinking that becomes its own trap. If a trader starts stretching targets unrealistically to improve the ratio on paper, they end up holding trades past logical exit points, watching winners turn into losers, and never actually banking the R:R they calculated.
During the 2022 Nasdaq bear market, traders who correctly identified short setups often held past the first wave of extension because their target was a full 30% lower. Those who took the first significant structural support as their target got paid. Those chasing the maximum theoretical R:R often gave back large open profits before the next bounce wiped them out.
A 1:2 trade that closes at target is worth more than a 1:5 trade that comes back to breakeven. R:R must be grounded in realistic market structure, not wishful thinking.
Putting It Together
R:R is a filter before you enter, not a calculation you run after you are already in. The question to ask before every trade is: “Is what I can make meaningfully larger than what I am risking, and is that target grounded in actual price structure?” If the answer is no, waiting for a better setup is the trade.
Over a hundred trades, traders who consistently seek 1:2 or better, even with a modest 40% win rate, will outperform traders who take any setup with good win-rate potential but poor R:R. The maths compounds in your favour.
Action Items
- Before your next entry, calculate the R:R explicitly: entry, stop distance, target. Write it down.
- Set a personal rule: no trades below 1:1.5 R:R. Stick to it for 20 trades and review the impact.
- Review your last 20 closed trades. What was the average R:R? Compare that against your actual win rate to see if the two are compatible.
- Identify one setup type in your current approach where the target is often arbitrary. Replace the arbitrary target with the next structural level from the chart.
Continue Learning
