✅ Titan Protect – Alpha Insights
🔹 Instrument: $NAS100USD
🛡️ Signal Type: Bullish Continuation | Cautious Breakout
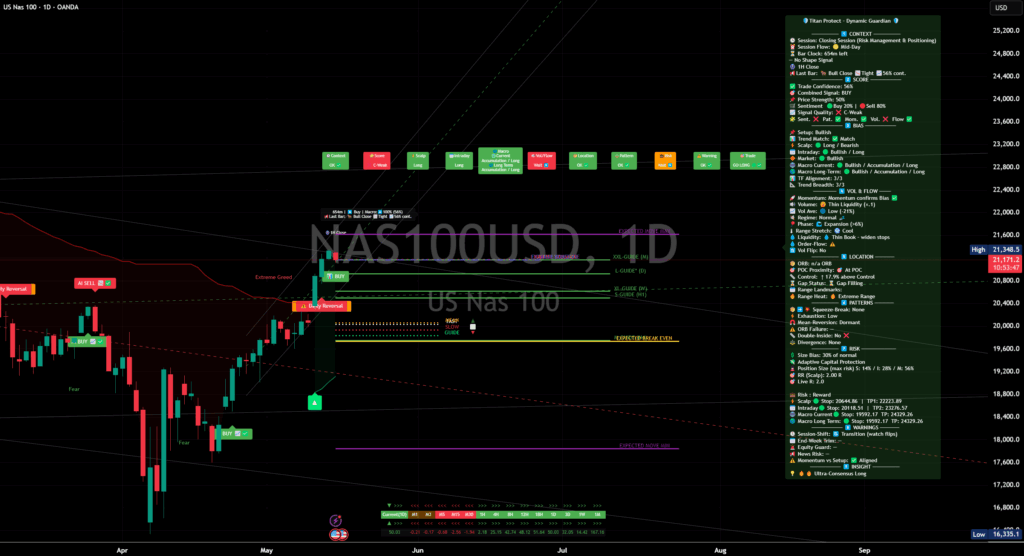
Price extended above yesterday’s inverted head-and-shoulders neckline and is now consolidating at the point-of-control around 21 170–21 270, riding the FAST and MEAN guides. Momentum remains positive, but implied volatility is elevated (VIX ≈ 18.3), so expect choppy swings ahead.
🔍 Supporting Titan Indicator References
• Trend Alignment: ✅ Bullish on all three tracked time-frames (3 / 3)
• Sentiment Gauge: ❌ 20 % Buy / 80 % Sell – follow-through remains thin
• Macro Score: ⚙️ 64 % – constructive but not euphoric
• Volatility Matrix: Expansion phase – implied vol elevated
• Titan Guide Lines: Price riding FAST & MEAN, well above SLOW support at 20 800
• Checklist: Mixed – caution flags are weak sentiment and thin liquidity
📌 Quick Setup Snapshot
• Breakout Trigger: Daily close above 21 350 opens the 21 600 → 22 250 path
• Compression Floor: 21 050 – 20 800 (FAST / SLOW confluence)
• Invalidation Zone: Clean daily close beneath 20 800 flips bias neutral-to-short
• Scalp Bias: Long on holds above 21 050; fade if 20 800 breaks and fails to reclaim
• Core Positioning: Partial longs from the breakout remain on; stops trailed to 20 860; targets 22 250 then 23 460
📊 Titan Indicator Snapshot
| Metric | Status | Comment |
|---|---|---|
| ✅ Trade Confidence | 🟡 56 % | Moderate conviction; thin follow-through |
| 💪 Price Strength | 🟡 50 % | Neutral mid-zone |
| 💬 Sentiment | 🟢 Buy 20 % / 🔴 Sell 80 % | Crowd chasing higher; fade risk exists |
| 🔄 Momentum | 🟢 Aligned | Confirms bullish tilt |
| 🔊 Volume | 🔴 Low (–21 % avg) | Thin liquidity; don’t chase moves |
| ⚡ Phase | 🟢 Expansion (> 6 %) | Breakout regime |
| 🌡️ Range Heat | 🟡 Cool | Extended but still room to run |
| 📍 Location | 🟢 At POC | Price hugging value |
🛠️ Actionable Setup Levels
| Bias | Stop | Target |
|---|---|---|
| Scalp-Long | 21 049 | 21 350 |
| Intraday-Long | 21 050 | 21 600 |
| Macro-Current | 20 860 | 23 460 |
🧠 Titan Summary Breakdown
🧭 Market Overview: Yesterday’s cooler-than-expected CPI print (+0.2 % m/m, 2.3 % y/y) sparked the broad rally. Today’s US PPI prints at 08 : 30 ET, followed by Powell’s remarks—both are potential volatility catalysts.
💡 Sector Flow: Semiconductors and AI infrastructure continue to lead; discretionary holds up; defensives and utilities lag—classic risk-on rotation.
🎯 Price Action: NASDAQ 100 is coiling at the breakout zone with no aggressive profit-taking so far. Structure remains intact, but volume has not yet picked up.
🔍 What I’m Seeing: Buyer conviction shows in the post-CPI surge, but thin follow-through and high vol warn against chasing. A hold above 21 050 keeps the bull case alive; failure risks a deeper pull-back toward 20 800.
🌐 Macro View: With PPI and Powell on deck, day-of event liquidity will be thin. Elevated vol favours smaller size and letting levels confirm before scaling.
✅ Final Word
The breakout is valid, yet elevated volatility and weak sentiment counsel patience. I’m running a 30 % size bias, ready to add on strength above 21 350 and step aside quickly if 20 800 fails. Patience over prediction—trade the levels, not the hope.
This is not financial advice—it’s how I’m managing my own book using Titan Protect.
🔒 Dynamic Guardian Full Panel Cheat-Sheet (Members Only Preview)
| Metric | Raw Status | Interpretation |
|---|---|---|
| 🕒 Session | Closing Session (Risk Management & Positioning) | We’re in the final hour—focus on risk control and position sizing. |
| 🔄 Session Flow | Mid-Day | Market momentum has plateaued—key levels may hold or flip. |
| ⏰ Bar Clock | 65 m left | Time remaining until the current daily bar closes. |
| 🔳 Shape Signal | No Shape Signal | No reversal or continuation pattern detected by the panel. |
| 1️⃣ Last Bar Close | Bull Close Tight 56 % cont. | Strong close, but narrow range—caution on follow-through. |
| 🎯 Trade Confidence | 🟡 56 % | Moderate conviction—wait for a decisive move. |
| 🎛️ Combined Signal | 🟢 BUY | Overall signals favour long entries. |
| 💪 Price Strength | 🟡 50 % | Mid-range—no extreme overbought/oversold condition. |
| 💬 Sentiment | 🟢 Buy 20 % / 🔴 Sell 80 % | Crowd is predominantly short—contrarian fade opportunity. |
| 🏷️ Signal Quality | C-Weak | Signals align, but quality is average—stay nimble. |
| ✔️ Sent. | OK | Sentiment module sees no immediate risk. |
| ✔️ Pat. | OK | Pattern checks passed—no alerts. |
| ✔️ Mom. | OK | Momentum confirms the current bias. |
| ❌ Vol. | – | Volume module is neutral. |
| ✔️ Flow | OK | Order-flow is not contradicting the directional bias. |
| 🛠️ Setup | Bullish | Current setup supports a long bias. |
| 📈 Trend Match | Match | Higher- and lower-timeframe trends are aligned. |
| 🔪 Scalp | Long / Bearish | Short-term lean long, but watch for intraday pullbacks. |
| 🕒 Intraday | Bullish / Long | Intraday pressure is on the long side. |
| 🌐 Market | Bullish | Overall market environment supports upside. |
| 🌍 Macro Current | Bullish / Accumulation / Long | Medium-term accumulation phase—bullish. |
| 📅 Macro Long-Term | Bullish / Accumulation / Long | Long-term sentiment remains constructive. |
| 📊 TF Alignment | 3 / 3 | All three tracked timeframes confirm the same direction. |
| 🔥 Trend Breadth | 3 / 3 | Market breadth is uniformly supporting the trend. |
| ⚡ Phase | Expansion (> 6 %) | Volatility regime is expansionary—expect wide swings. |
| 🔊 Volume | Thin Liquidity (× 0.1) | Lower-than-normal volume—price moves may be erratic. |
| 📉 Vol Avg | Low (– 21 %) | On-average volume is well below normal. |
| 🗺️ Regime | Normal | No regime shift—markets behaving within expected parameters. |
| 🌡️ Range Stretch | Cool | Recent move is extended but retains room to run further. |
| 📍 POC Proximity | At POC | Price is testing the point-of-control—key value area. |
| ⚖️ Control | 17.9 % above Control | Price trading well above control level—bullish context. |
| 👉 Gap Status | Gap Filling | Price is retracing to fill yesterday’s gap—common mean-reversion. |
| 🌡️ Range Heat | Extreme | Current range is at the upper threshold—potential for pullback. |
| 🔍 Patterns: Squeeze-Break | None | No squeeze-break or volatility roll-off patterns detected. |
| 🛑 Exhaustion | Low | No signs of exhaustion—trend may continue. |
| 🔄 Mean-Reversion | Dormant | No mean-reversion signals—trend remains dominant. |
| ⛔ ORB Failure | – | Opening range boundary holds—no failure. |
| ❌ Double-Inside | No | No double-inside reversal pattern. |
| 📉 Divergence | None | No momentum vs. price divergence detected. |
| ⚖️ Size Bias | 30 % of normal | Position sizes are reduced due to elevated event risk. |
| 🛡️ Adaptive Protection | Active | Protective algorithms are engaging—stop placement widened. |
| 📏 Position Size (max risk) | S: 14 % / L: 28 % / M: 56 % | Maximum risk per timeframe is scaled to these percentages. |
| 🎯 RR (Scalp) | 2.0 R | Risk/reward for scalp trades targets 2R. |
| ⚡ Live R | 2.0 | Current live trade offers a 2.0 reward multiple. |
| ⚠️ Session-Shift | Transition (Watch Flips) | Potential flip area—monitor for shift in session direction. |
| 🪙 End-Week Trim | – | No end-of-week trimming scheduled. |
| 🛡️ Equity Guard | – | Equity guard module inactive. |
| 📰 News Risk | – | No high-impact news events pending. |
| 🔄 Momentum vs Setup | Aligned | Momentum aligns with the setup—bolsters conviction. |
| 💡 Insight | Ultra-Consensus Long | Broad consensus among modules supports a strong long bias. |
