Daily Framework Read | Tuesday 22 April 2026
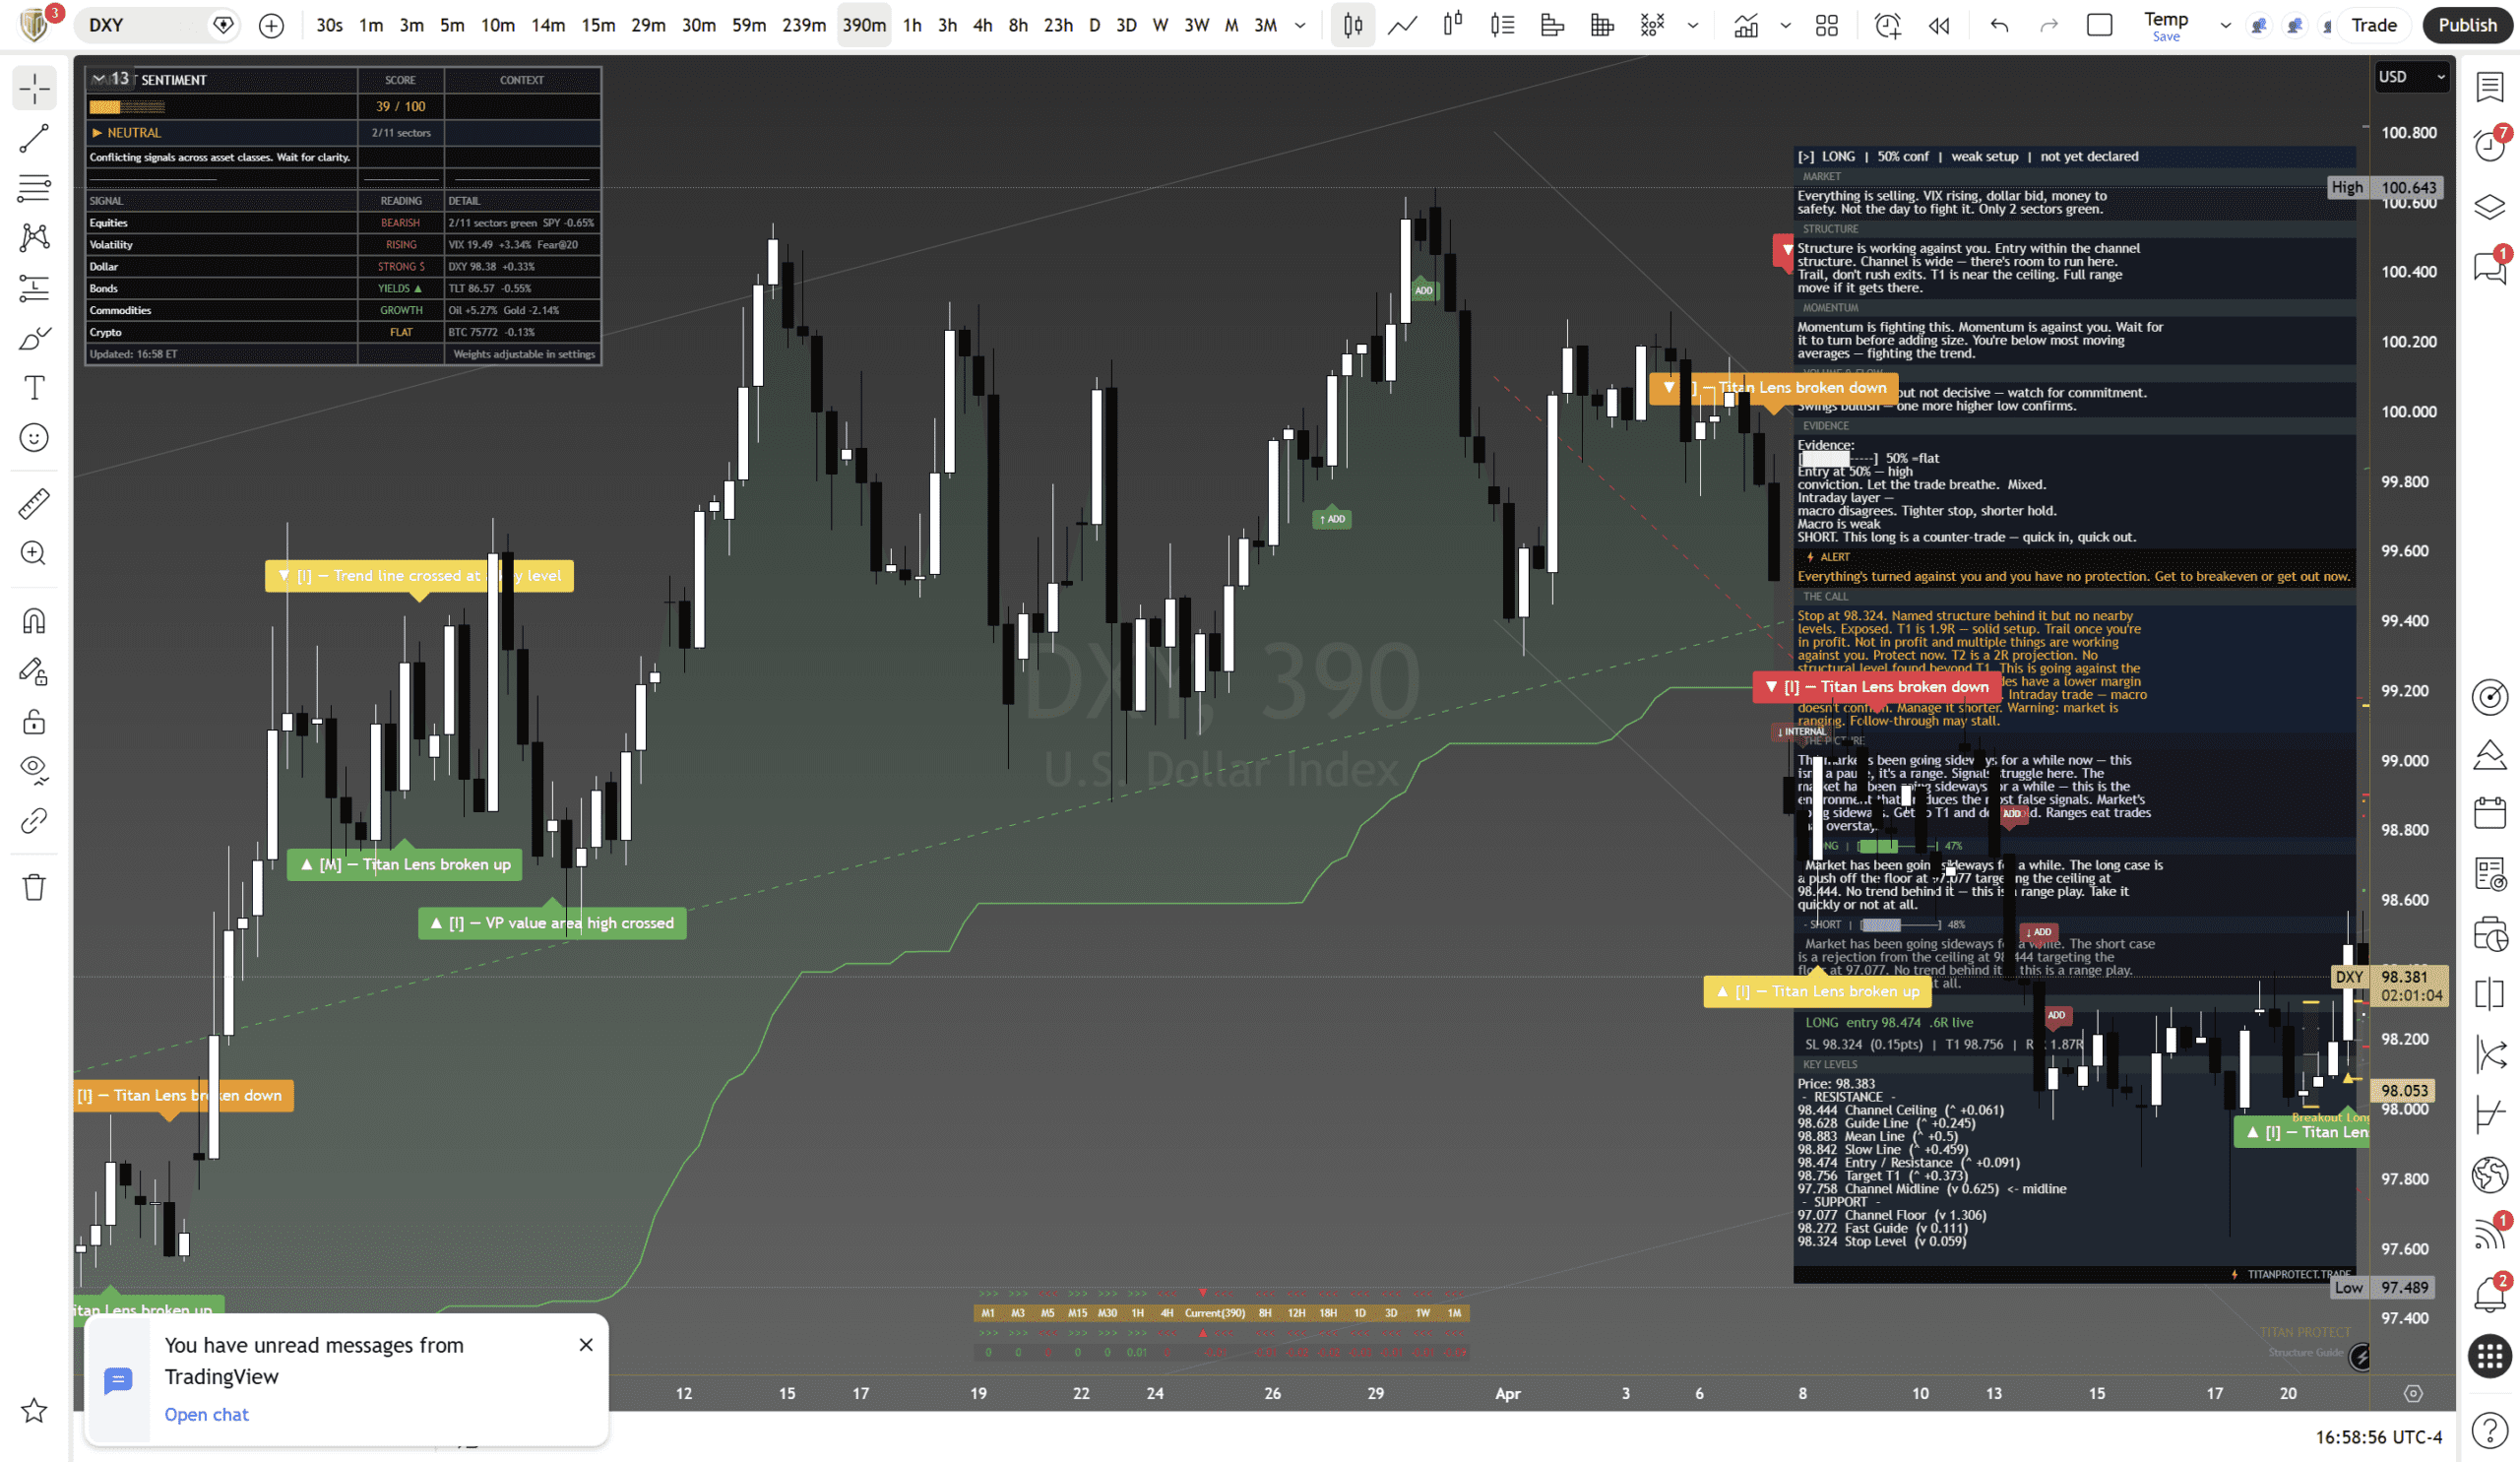
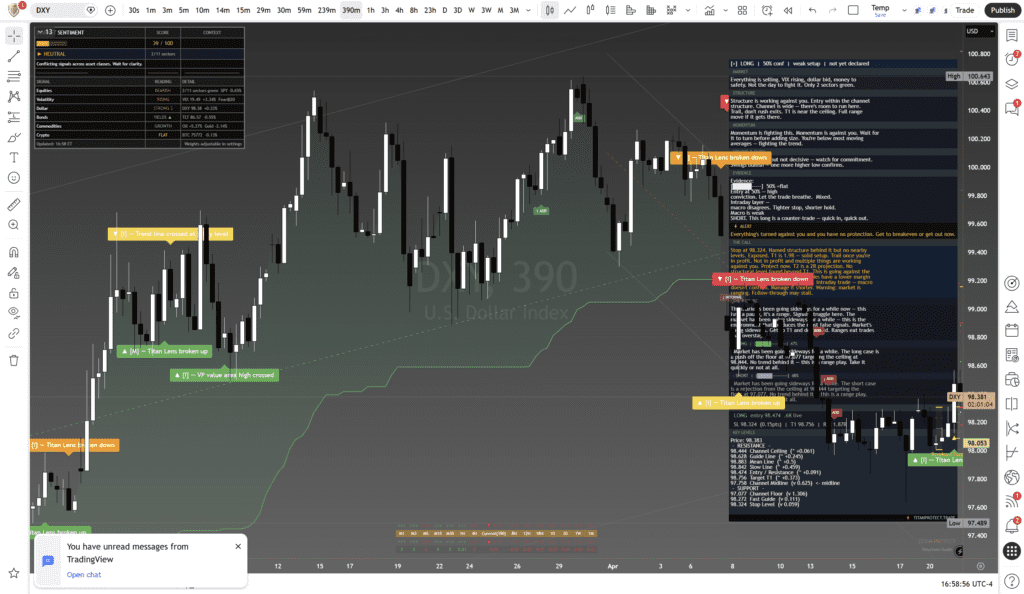
The Dollar Index has been going sideways for a while now — this is a range, not a trend. The market is bouncing between the 97.077 floor and the 98.444 ceiling. No trend behind it. Ranges eat false signals. The market has been sideways for a while and momentum is fighting the current long setup. Everything has turned against you — get to breakeven or get out.
Structure
Structure is working against the long. Entry is within the channel — there is room to run to the ceiling. But momentum is fighting the move. Below most moving averages. You are fighting the trend if you go long here.
Momentum and Flow
Momentum is against the long setup. Below all four moving averages. The swings are bearish — lower highs, lower lows. Wait for momentum to turn before adding size.
Sellers pressing with active selling, not just profit taking. Swings confirmed bearish. The overall trend favours the downside even as the range holds.
The Two Cases
A push off the floor at 97.077 targeting the ceiling at 98.444. No trend behind it — this is a range play. Take it quickly or not at all. Momentum needs to confirm.
A rejection from the ceiling at 98.444 targeting the floor at 97.077. No trend behind it either. This is a range play — take it quickly.
Key Levels
| Resistance | 98.44 | Channel Ceiling |
| Resistance | 98.47 | Entry / Resistance |
| Pivot | 98.88 | Mean Line |
| Support | 98.32 | Stop Level |
| Support | 97.76 | Channel Midline |
| Support | 97.08 | Channel Floor |
Market Context
DXY +0.51% today. Dollar bid from risk-off but stuck in range. VIX at 20.29, Gold -2.29%, flight to cash but no range breakout yet.
Analysis from our institutional research desk. Educational content only — not financial advice. Market data as of 21 April 2026. Past performance is not indicative of future results. All trading involves risk — manage yours. Independent analysis — no affiliation with any broker. Always do your own research before trading.
