Earnings Echo: 300 Reports, One Dominant Theme, and What Options Are Pricing for Next Week
The Q1 2026 earnings season has not finished. Roughly 300 reports were filed in the week just passed, and the queue for the coming week runs from Tuesday through Thursday with names that genuinely move markets. The season’s dominant theme has been guidance. Not the headline beats, which have been broadly fine. The question the options market has been asking all season is what comes next. Consumer sentiment at a 74-year low, inflation expectations at 4.8%, a new Federal Reserve Chairman with an unannounced policy orientation, and a tariff backdrop that has compressed margins across industrials and consumer discretionary. Companies are reporting into that environment, and the guidance language is the part that actually moves stock prices.
The AAII special question this week asked members specifically how they would describe the earnings guidance given during Q1 2026 season. The answer from the institutional community visible in options positioning is fairly clear: guidance has been cautious enough that the put-call ratio has stayed at 0.726, and seven out of the eight names with significant options activity have seen bullish flow in single-name options despite a market that feels fragile at the macro level. That contradiction, cautious guidance alongside bullish single-name options positioning, is the earnings story of the week.
The market is not collapsing on weak guidance because the buyers are buying individual company resilience, not the macro backdrop. The options flow in NVDA, AAPL, TSLA, META, MSFT, AMD, and AMZN has been net bullish even as QQQ itself attracts bearish put flow at the index level. This is exactly what the institutional post described: selective buying of quality names while hedging the index. The earnings picture is the underlying reason why.
| Name | Reports | Options Flow | Implied Vol | Earnings Implication |
|---|---|---|---|---|
| NVDA | Recently reported | 217.5 strike, 58,235 contracts | 25.1% IV | The dominant options story of the week. Largest call volume in the dataset. The market is not hedging NVDA, it is positioning for continuation of the AI infrastructure theme. Post-earnings flow is confirming the bull case remains intact in options markets even as the stock has pulled back from highs. |
| AMZN | Recently reported | 270 strike, 24,297 contracts | 18.6% IV | Call flow at the 270 strike with 24,297 contracts is significant. Amazon’s cloud and advertising businesses have been resilient through the tariff environment. The options flow is pricing continued strength, consistent with the institutional post’s observation that selective long positioning is concentrated in quality mega-cap names. |
| TSLA | Recently reported | 427.5 strike, 14,406 contracts | 28.7% IV | Highest implied volatility in the covered names. The put flow at 427.5 is the hedging side of a complex picture. TSLA carries the highest vol premium because the range of outcomes around brand risk, tariff impact on EV pricing, and Musk attention is wider than any other mega-cap. This is not a clean directional read, it is a vol play. |
| AAPL | Recently reported | 307.5 strike, 13,701 contracts | 14.5% IV | The put activity in AAPL looks like hedging against a pullback rather than outright bearish positioning. The institutional flow is broadly bullish on AAPL as a mega-cap quality name, but the put activity at 307.5 is defensive cover on a position that has run. Low IV of 14.5% means the protection is still relatively cheap. |
| AMD | Recently reported | 477.5 strike, 4,607 contracts | 65.4% IV | The outlier. AMD implied volatility at 65.4% is dramatically elevated, the highest in the dataset by a wide margin. Someone is positioning for a very large move in AMD. At 477.5 calls, the market is pricing a significant upside scenario. This is the kind of elevated IV that appears when a catalyst is expected but not fully known. Watch for AMD-specific news over the weekend. |
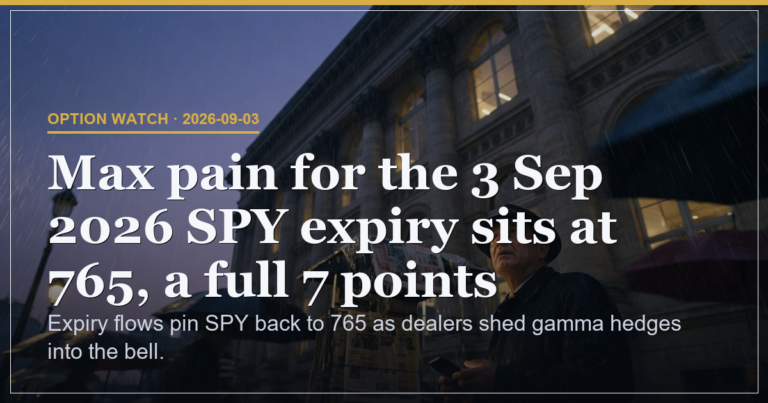
| SPY | Max pain expiry 26 May | 747 strike, 41,503 contracts | 8.3% IV | The biggest single name by volume. 41,503 put contracts at the 747 strike with an IV of only 8.3% is near-term insurance bought cheaply. Max pain for the 26 May expiry sits at $739, well below Friday’s close of $745.64. The market maker community has incentive to pin SPY near 739-745 through Friday’s expiry. |
| QQQ | Max pain expiry 26 May | 719 strike, 20,211 contracts | 12.3% IV | QQQ is the only name classified as bearish in the options market sentiment read. The put flow at 719 is the index-level hedge against the very single-name bullishness described across NVDA, AAPL, META, MSFT. Institutions are long the components, short the index wrapper. That divergence is the clearest institutional positioning signal in the options data. |
Three sector themes emerge from the earnings calendar that directly connect to what the sector rotation post identified on Friday:
Technology and AI Infrastructure (XLK). The combination of Salesforce, Marvell, Synopsys, Snowflake, and Dell in the same week amounts to a full AI infrastructure health check. If CRM shows enterprise software budgets intact, MRVL shows chip demand strong, and DELL shows server orders accelerating, the AI cycle thesis that has been driving XLK and the NVDA call flow gets confirmed in earnings data, not just options positioning. This is the sector that wins the week if the data cooperates.
Consumer Discretionary (XLY). Best Buy, Dick’s Sporting Goods, and Abercrombie are reading consumer health directly. Consumer sentiment at a 74-year low should, in theory, be showing in discretionary spending. But equity prices and consumer confidence have been divorced all year. If BBY reports decent results with maintained guidance, it means the consumer is better than they say they feel. If BBY misses badly, the sentiment divergence analysis from post 02 gets an earnings confirmation and the disconnect between mood and index levels starts to resolve.
Financials (XLF). The Canadian banks on PCE Thursday are the global financial stress test of the week. BMO, BNS, RY, TD, and CM reporting in the same week as a new US Fed Chairman and a PCE print creates a financial sector event that could move XLF in either direction. If the Canadian banks signal stress in lending conditions or rising credit losses, it raises questions about the US banking picture that the institutional flow analysis was already flagging through XLV outperformance over XLF.
The options market is net bullish on mega-cap technology names and net cautious on the QQQ index wrapper. The earnings calendar is front-loading technology confirmation events in the first three trading days. If the earnings data confirms what the options market is pricing, the technology sector extension trade works. If earnings disappoint, the QQQ put protection pays off and the sectors that have been defensively positioned, healthcare and energy, become the week’s leaders by default.
Headline earnings beats are not the signal. Companies have been managing expectations downward through the tariff environment, which means beating a sandbagged number means less than it normally would. The three guidance signals that actually matter this week:
Forward margin commentary. Any mention of tariff-related margin compression continuing into Q2 and Q3 is the signal the market is most sensitive to. Salesforce and Marvell will both be asked specifically about this on their calls.
AI capex demand wording. Dell’s order book language around AI server demand is the concrete earnings confirmation of the AI infrastructure cycle that the NVDA call options are pricing abstractly. If Dell says demand is strong, the call flow is validated. If Dell hedges, the thesis has a crack.
Consumer health language from BBY and DKS. Both companies have direct consumer contact at the discretionary spending level. Their guidance language will either confirm or contradict the 74-year sentiment low. If they are cautious, the Consumer Confidence print on Tuesday has more weight behind it.
CRM, MRVL, and DELL all beat with maintained or raised guidance. AI infrastructure narrative validated in earnings data. NVDA call flow confirmed. XLK extends past $181.73. QQQ puts expire worthless. The single-name bull case wins over the index-level hedging.
Some names beat, some miss. BBY disappoints on consumer health, partially offset by CRM beating on enterprise. The sector rotation picture remains coiled and unresolved heading into PCE Thursday. Options theta decay hurts both bulls and bears. The market waits for the macro catalyst.
Cautious forward guidance from two or more major names. BBY confirms consumer stress. Dell hedges AI order language. Consumer Confidence Tuesday amplifies the mood. The options market begins pricing a re-rate of forward earnings expectations. QQQ puts gain. Healthcare defensive positioning vindicated.
Hot PCE Thursday with new Fed Chairman commentary resets the backdrop entirely. Earnings results become irrelevant against a sudden policy repricing. All guidance language re-read through a higher-for-longer lens. Financials only sector to benefit. AMD elevated vol materialises for the wrong reason.
The earnings risk sits at around 55% for the week, slightly elevated from a normal earnings period for three reasons. First, the Thursday PCE print can override any earnings read from earlier in the week by changing the discount rate against which all forward guidance is valued. Second, AMD’s implied volatility at 65.4% suggests the options market knows something that is not yet public. A name with that elevated IV carries event risk that can spill into the broader sector. Third, the QQQ put flow running against mega-cap name bullishness means the index-level expression of technology exposure is structurally hedged in a way that amplifies any gap between single-name and index performance.
The primary opportunity in this picture is the Dell earnings trade on Thursday. It is the clearest single-name earnings catalyst with direct read-across to the AI infrastructure theme that the options market has been pricing all week. Define the risk through the stock’s implied move, hold through PCE if conviction is high, and treat the two events as separate rather than compounding.
This post cross-references the options structure analysis in Post 08, the sector rotation picture from Post 09, and the institutional flow detail from Post 07. The specific options metrics cited, put-call ratios, implied volatility readings, and unusual activity volumes, are from the same data set used to build those earlier analyses.
This content is for informational and educational purposes only and does not constitute financial advice, investment advice, or a recommendation to buy or sell any financial instrument. Options trading involves significant risk and is not appropriate for all investors. Past analysis does not guarantee future results. All earnings dates and options data reflect information available as of Saturday 23 May 2026 and are subject to change. Always conduct your own research and seek professional advice before making any investment decisions.
Deepen Your Understanding
Related articles from the Titan Protect Foundry: