Retail vs. Institutional Sentiment

Retail vs. Institutional Sentiment

Fear and Greed Indicators

The Two Forces That Move Markets

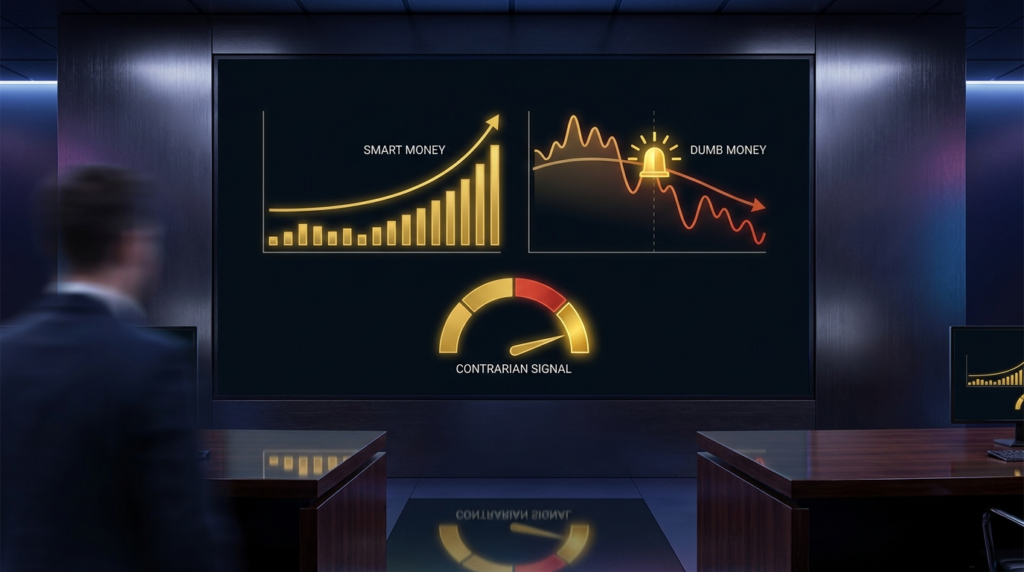
Warren Buffett famously said: “Be fearful when others are greedy, and greedy when others are fearful.” This wisdom captures the essence of sentiment analysis. Fear and greed are the twin engines of market movement, and learning to measure them transforms your trading from guesswork into probability assessment.

Every price tick represents a battle between these emotions. When fear dominates, assets get cheap. When greed takes over, they get expensive. Your job is to recognize which force is in control.

Key Fear Indicators

When markets crash, these tools measure the panic:

VIX (Volatility Index)

  • Measures expected 30-day volatility
  • Readings above 30 indicate elevated fear
  • Spikes above 40 signal extreme panic
  • Sustained lows suggest complacency
  • “The fear gauge” of the market
  • Put/Call Ratio

  • Compares put buying to call buying
  • Ratio above 1.0 shows fear (more puts)
  • Extreme readings above 1.5 mark capitulation
  • 5-day moving average smooths noise
  • Available for individual stocks and indices
  • AAII Sentiment Survey

  • Weekly survey of individual investors
  • Bullish, bearish, and neutral percentages
  • Extreme bearish readings (>50%) are bullish signals
  • Extreme bullish readings (>60%) are bearish signals
  • Free data with decades of history
  • Safe Haven Flows

  • Treasury bond buying surges
  • Gold and silver demand increases
  • Dollar strength in forex markets
  • Defensive sector rotation
  • Risk asset correlation approaches 1.0
  • CNN Fear & Greed Index

    One of the most accessible sentiment composites:

    Components (Equally Weighted):

  • Market Momentum (S&P 500 vs 125-day MA)
  • Stock Price Strength (new highs vs lows)
  • Stock Price Breadth (advancing vs declining volume)
  • Put/Call Ratio (5-day average)
  • Junk Bond Demand (spread vs investment grade)
  • Market Volatility (VIX and 50-day MA)
  • Safe Haven Demand (stocks vs bonds)
  • Reading the Index:

  • 0-20: Extreme Fear (potential buying opportunity)
  • 21-40: Fear (caution, watch for reversal)
  • 41-60: Neutral (trend continuation likely)
  • 61-80: Greed (caution, watch for topping)
  • 81-100: Extreme Greed (potential selling opportunity)
  • Learn With Titan

    Key Takeaways

  • Fear and greed drive all market movements
  • VIX is the most widely watched fear gauge
  • Extreme readings in either direction create opportunity
  • Contrarian trading works best at sentiment extremes
  • Combine multiple indicators for reliable signals
  • Sentiment analysis works best with price confirmation
  • The market will always swing between fear and greed. Your edge comes from recognizing where we are in that cycle and positioning accordingly. When others panic, stay calm. When others celebrate, stay cautious.

    Get the daily framework intelligence

    Trade the framework, not the noise.

    The principles in this article are how we read markets every day. Members get the live application: daily Pre-Asia, Pre-London, Pre-NY and Post-Close briefs across 20+ instruments, the indicator suite, the Foundry library, and live community.

    Free Explorer tier · No card required · Upgrade when you’re ready

    Continue Reading

    Positioning Extremes and Reversals

    22 Feb 2026

    The VIX and Volatility Expectations

    22 Feb 2026

    Options Flow Sentiment

    22 Feb 2026