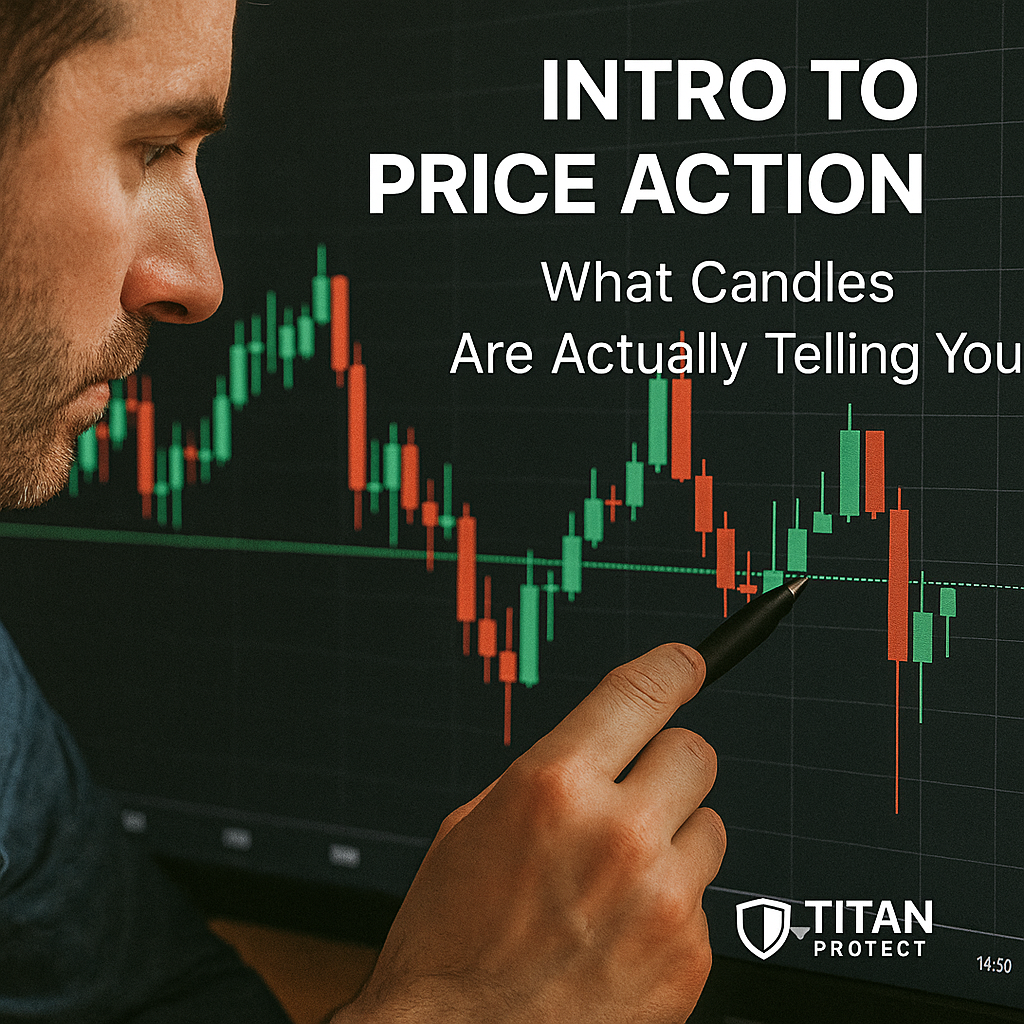
What Candles Are Actually Telling You
Price action is one of the first things new traders hear about — but also one of the most misunderstood.
It isn’t about memorising candlestick names or obsessing over every wick. It’s about reading what the market is doing right now — and how it’s reacting to structure, volume, and flow.
Let’s break down how to start thinking like a price action trader — without overcomplicating it.
🔍 What Is Price Action, Really?
Price action is the language of buyers and sellers. Every candle is a reflection of:
Who’s in control (buyers or sellers)
Where they’ve defended or failed
How price behaves around key areas
When you learn to read price action, you’re not predicting the future — you’re responding to the current story.
❌ The Problem With Candle Pattern Memorisation
There’s a time and place for learning terms like:
Pin bar
Engulfing
Doji
Tweezer
But without context, these patterns are meaningless.
A bullish engulfing candle:
At support? Useful.
In no-man’s land? Misleading.
Against the trend? Risky.
Patterns matter, but location and reaction matter more.
✅ How to Read Price Action in Layers
Start With Structure
Look left. What is the price reacting to? Are we at a key level, in a trend, or inside a range?Zoom Into Candles
What is the story of the candle?
• Long wick = rejection or liquidity grab
• Small body = indecision
• Strong close = convictionWatch Reactions, Not Predictions
Does price respect the level and bounce? Or does it wick through and stall? That’s your tell.Use Time
Give price a few bars to develop. Don’t force a narrative after one candle.
🧠 Simple Price Action Exercise
Pick one level (support/resistance) on a 15m or 1H chart.
Now wait.
When price reaches that zone:
Watch how it behaves
Take note of the candle shape and size
Wait for confirmation — not hope
Do this daily for a week and you’ll learn more than hours of YouTube.
🛡️ Learn With Titan
Titan Protect includes advanced price action logic built right into your chart — so you can focus on the story, not the stress.
Key Titan tools:
✅ Reversal structure + candlestick pattern detection
📊 Signal scoring that prioritises reaction, not just pattern
🔁 Reaction zones to show likely battle points
🧠 Confluence filters to confirm with context (trend, volume, structure)
We help you read the why behind the candles — not just the what.
📩 [Reach out to see it live or explore the Members’ Area]


