🔄 Understanding Market Cycles
🎯 The Rhythms That Drive Returns
Markets don’t move in straight lines—they cycle through predictable phases of expansion and contraction. Recognizing where we are in the cycle is half the battle.
📊 The Four Market Phases
The Cycle Structure
Every market cycle contains four distinct phases. No two cycles are identical, but the pattern repeats.
| Phase | Characteristics | Strategy Focus |
|---|---|---|
| Accumulation | Bottoming, low volume, disinterest | Research, small positions |
| Markup | Rising prices, increasing volume | Trend following, longs |
| Distribution | Topping, high volume, euphoria | Profit-taking, hedging |
| Markdown | Declining prices, panic selling | Defense, shorting, cash |
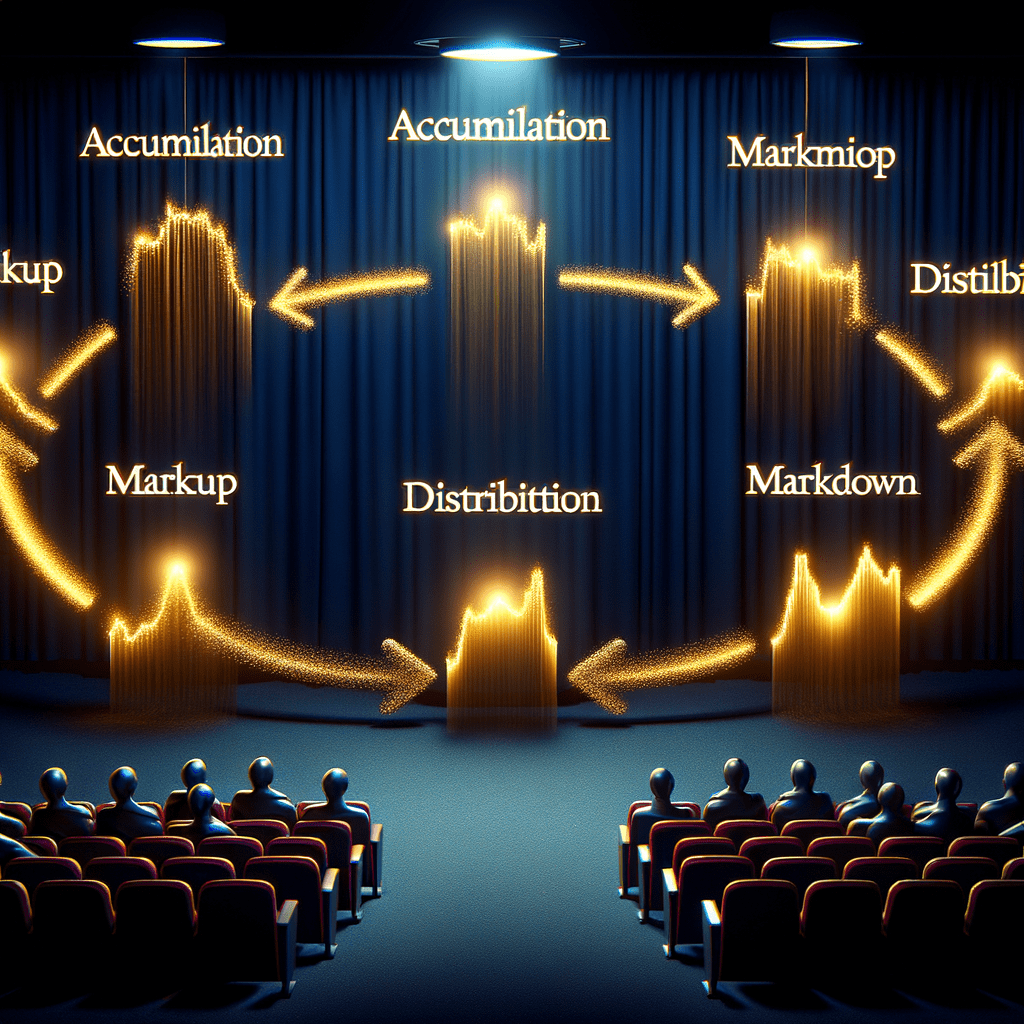
Visualizing the Cycle
Price
  ↑    Distribution    Markup
  ↑         ↘         ↗
  ↑          ↘       ↗
  ↑           Markdown    Accumulation
  ↑
  +──────────────────────────────→ Time
🧠 Business Cycles vs. Market Cycles
Economic Cycle Phases
| Phase | Economy | Markets | Best Assets |
|---|---|---|---|
| Early Recovery | Growth accelerating | Bull market begins | Stocks, cyclicals |
| Mid-Cycle | Strong growth | Bull market continues | Stocks, commodities |
| Late Cycle | Growth peaking | Distribution begins | Quality, value |
| Recession | Contraction | Bear market | Bonds, cash, defensives |
The Lag Effect
- Markets lead the economy by 6-12 months
- Stocks bottom before economic data improves
- Stocks top before recession officially begins
📈 Sector Rotation Through Cycles
The Sector Cycle
Different sectors outperform at different cycle stages:
| Cycle Stage | Leading Sectors | Why |
|---|---|---|
| Early Recovery | Financials, Consumer Discretionary | Rate sensitive, pent-up demand |
| Mid-Cycle | Technology, Industrials | Growth acceleration |
| Late Cycle | Energy, Materials, Staples | Inflation, defensive |
| Recession | Utilities, Healthcare, Bonds | Safety, dividends |
Rotation Signals
- ✓ Relative strength shifts between sectors
- ✓ Yield curve changes predict rotation
- ✓ Economic data surprises drive movement
- ✓ Earnings revisions cluster by sector
🎯 Identifying Cycle Position
Accumulation Phase Markers
- Volume dries up at lows
- Smart money buying quietly
- Retail sentiment extremely bearish
- Valuations at historical discounts
- Capitulation selling completed
Markup Phase Markers
- Breakout above resistance
- Volume expansion on rallies
- Moving averages align bullish
- Breadth improves (more stocks participating)
- Corrections are shallow and brief
Distribution Phase Markers
- Volume high but prices stall
- Divergences appear (price vs. breadth)
- Retail enthusiasm peaks
- Leadership narrows to few names
- Volatility increases
Markdown Phase Markers
- Support levels break
- Volume spikes on declines
- Bearish moving average crossovers
- Breadth deteriorates
- Safe-haven assets outperform
🎓 Learn With Titan
| Current Signal | Likely Phase | Titan’s Strategy |
|---|---|---|
| VIX >30, AAII bears >50% | Late Markdown/Early Accumulation | Start researching quality |
| Breakout on strong volume | Markup beginning | Trend following mode |
| Euphoria, IPO frenzy | Late Markup/Early Distribution | Trim, add hedges |
| Failed rallies, lower highs | Markdown underway | Raise cash, defense |
⚠️ Cycle Traps
- Calling tops/bottoms too early — Cycles take time
- Ignoring the long-term trend — Don’t fight monthly charts
- Assuming symmetry — Bull and bear phases differ in length
- Missing the rotation — Old leaders rarely lead next cycle
- Cycle myopia — Multiple cycles nest (daily, weekly, yearly)
💡 Key Takeaways
- 🎯 Cycles repeat because human nature doesn’t change
- 🎯 No one rings a bell at turning points—watch the evidence
- 🎯 Different strategies work in different phases
- 🎯 Flexibility beats stubbornness in cycling markets
The market cycle is like the seasons. You don’t plant in winter or harvest in spring. Know your season.
Part of the Trading Academy Series | Powered by TitanProtect 🛡️
